Micro-CT 촬영기법에 의한 재배지 참당귀의 뿌리 특성
 ; Ki Yoon Kim
 ; Su Jin Sim
 ; Chung Ryul Jung
 ; Hyun Jun Kim
 ; Kwon Seok Jeon
 ; Hong Woo Park†
This is an open access article distributed under the terms of the Creative Commons Attribution Non-Commercial License (http://creativecommons.org/licenses/by-nc/3.0/) which permits unrestricted non-commercial use, distribution, and reproduction in any medium, provided the original work is properly cited.
Abstract
We measured the weight characteristics, intercellular space volume as a proportion of root volume, and quantities of the functional component in Angelica gigas Nakai, collected from four cultivation areas in Pyeongchang, including Tapdong-ri and SangjinBu-ri, and tested the results for correlations.
Dry weight was the highest in the Tapdong-ri group (13.37 ± 0.13 g) and the lowest in the SangjinBu-ri group (11.90 ± 0.57 g). The percentage of intercellular spaces within the roots, determined by micro-CT camera, was the highest in the Tapdong-ri group (6.44 ± 0.76%) and the lowest in the SangjinBu-ri group (9.01 ± 2.15%). The quantity of functional components were the highest in the Tapdong-ri group (116.13 ± 9.53 ㎎/g) and the lowest in the SangjinBu-ri group (99.77 ± 23.23 ㎎/g).
The dry weight of A. gigas significantly correlated with the volume and percentage of intercellular space. An increase in the dry weight resulted in a negative correlation between the volume and ratio of the intercellular spaces. The volume of intercellular space correlated negatively with levels of the functional components, this was significant in the case of the nodakenin, decursin and decursinol angelate content (p < 0.016).
Keywords:
Angelica gigas, Dry Matter, Intercellular Space, Micro-CT, Regression Analysis서 언
참당귀 (Angelica gigas Nakai)는 산형과 (Apiaceae)에 속하는 식물로서 (Lee, 2003) 중국의 동북부, 일본 및 한반도 전역에 자생하고 있으며 (Lee, 2006), 우리나라에서는 주로 강원도 (평창군, 태백시, 인제군), 경상북도 (봉화군)에서 재배하는 약용작물이다 (Yu et al., 2003).
참당귀는 뿌리를 약재로 사용하는 식물로 예로부터 보혈 (補血), 활혈지통 (活血止痛), 윤장 (潤腸) 등의 효능으로 심간혈허 (心肝血虛), 월경불순 (月經不順), 통경경폐 (痛經經閉) 등의 병증에 주로 사용하며 (Seo et al., 2008), coumarin 계열의 nodakenin, decursin, decursinol angelate 등의 물질이 참당귀의 지표성분으로 알려져 있다 (Kim et al., 2007; Kim et al., 2011). 최근 연구에 따르면 세포내 혈관생성의 억제를 통한 항암효과 (Son et al., 2009), 뿌리에서 분리된 화합물의 항염증작용 (Lee et al., 2003; Nam and Baik, 2016), 관절연골 소실 억제 작용 (Kwon et al., 2015), 참당귀 뿌리 및 잎 추출물의 혈당강화 효능 (Park et al., 2009a; Jeong et al., 2015) 등 다양한 약성효능에 대한 연구 및 멜라닌 색소 생성 억제를 통한 미백 소재의 화장품 (Park et al., 2009b; Kim et al., 2014b), 제과류 등의 식품 (Moon and Jang, 2011) 등 다양한 분야에서 연구가 보고되고 있다.
이러한 참당귀의 뿌리에는 3 - 5 세포층으로 이루어진 코르크층의 주피와 함께 피층에는 직경 90 - 150 ㎛의 유조직이 다수 분포한다 (Sung et al., 2004). 이에 따라 피층 부위의 빠른 비대생장 속도에 의해 (Lee et al., 2000) 대형의 세포간극이 존재하며 (Ahn et al., 2011), 일반적으로 그 공간에는 공기나 이산화탄소, 수분 등의 물질이 분포하고 있다.
지금까지 식물조직 내부의 구조를 이해하기 위해서는 기존의 방법인 파라핀을 이용하여 식물조직을 고정시킨 후 얇게 절편하여 조직의 염색과정을 거친 후 광학현미경으로 관찰하는 방법을 사용하였다 (Song and Hong, 2012; Jang and Oh, 2016). 하지만 이 실험방법에는 2 - 3 일의 전처리 시간과 큰 직경의 시료를 관찰하기가 용이하지 않고, 관찰 대상조직의 면적이나 크기의 정량화가 어렵다는 문제점이 있다.
최근 기술의 발달로 의학이나 산업에 사용되는 촬영방법 (Tuan and Hutmacher, 2005; Buie et al., 2007; Gainkam et al., 2008; Dejaco et al., 2012)이 식물의 생리를 확인하는 방법으로 도입되고 있다. Neutron radiography 및 tomography 기술을 활용해 토양 속 뿌리의 생육 현황 및 위치를 관찰하거나 (GATSC, 2005; GGMCES, 2005; Burr-Hersey et al., 2017), X-ray 단층 촬영을 통한 뿌리 중심주의 수분 퍼텐셜의 시각적 이해 (Torres-Ruiz et al., 2015), micro-CT 촬영을 이용한 잎의 통기 구조 확인 및 정량화 (Mathers et al., 2018) 등 식물 뿌리의 발달과정이나 해부학적 구조를 이해하는데 많은 방법을 사용하고 있다. 그 중 micro-CT 촬영을 통한 식물체 관찰 (Paquita et al., 2011; Karahara et al., 2015)은 전처리의 과정 없이 비파괴촬영 (non destructive testing) 방식을 통해 보다 쉽게 식물의 해부 구조를 관찰하고, 특정 위치의 면적을 정량화할 수 있다.
따라서 micro-CT 촬영기기를 이용하여 참당귀의 뿌리 단면을 관찰하고, 세포간극의 3 차원 면적을 구하여 뿌리의 세포간극 부피와 건중량, 지표성분 간의 상관관계를 구명하고자 하였다.
재료 및 방법
1. 연구재료
실험재료는 동일한 기상조건을 위해 재배지에서 11월 4일에 수확한 참당귀 (Angelica gigas Nakai)의 지하부를 사용하여 건중량과 수분율을 조사하였고, 단층분석은 micro-CT 촬영을 이용하여 지하부의 간극특성을 관찰하였다. 또한 유용성분 분석과 통계분석을 위해 재배지별 3 반복 측정으로 수행하였다. 4 곳의 재배지 모두 2018년 12월 동일한 품종 (영흥당귀)의 열매를 비닐하우스에 파종하여 생육한 모종을 사용하여 재배하였다. 재배지의 위치 및 정보는 Table 1에 기재하였다.
2. 건중량 및 수분율
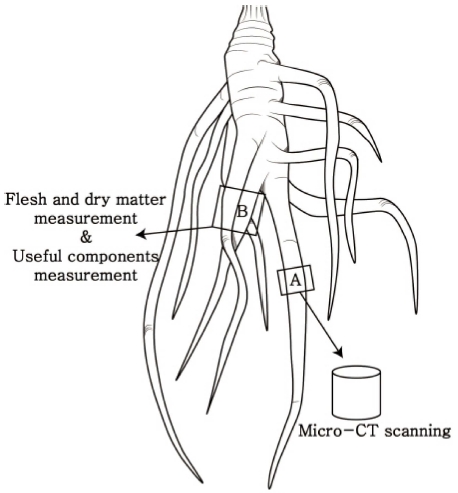
각 재배지에서 수집된 참당귀의 지하부 중 직경 1.5 ㎝ 내외의 뿌리를 사용하여 생중량 50 ± 0.02 g에 맞추어 개체당 3 반복씩 총 3 개체를 측정하였다. 이를 건조기 (Lassele DY-420H, Lassele Co., Ansan, Korea)에서 40℃, 72 시간 동안 건조시킨 후 각각의 건중량 및 수분율을 측정하여 재배지별 평균을 확인하였으며, 시료 사용 부위를 Fig. 1에 도해하였다.
3. Micro-CT 촬영
시료의 부피 특성 분석을 위해 Micro-CT 촬영기기 (Skyscan 1272, Bruker Inc., Kontich, Belgium)를 사용하여 Fig. 1과 같이 참당귀의 직경 1.5 ㎝ 내외의 뿌리를 절취한 후 수분손실을 막기 위해 시료 표면을 파라필름으로 감았다. 그리고 image pixel size 15 ㎛, frame averaging 4, rotatin step 0.2의 촬영 조건을 설정하였으며 참당귀 지하부의 대형 세포간극의 크기와 비율을 산출하였다.
4. 유용성분 분석
참당귀 지하부 건조분말 10 ㎎을 100% 메탄올 1 ㎖에 60분간 초음파 추출 후 여과된 추출물을 사용하였다. 고정상은 ACQUITY UPLC® BEH C18 Columm (100 ㎜ × 2.1 ㎜, 1.7 ㎛, Waters Co., Milford, MA, USA)을 사용하였고, 이동상은 0.1% 개미산이 함유된 물과 아세토니트릴을 사용하였다. 이동상 조성은 시간에 따라 변화시키는 기울기 용리를 사용하였다.
참당귀의 유용성분 (nodakenin, decursin, decursinol angelate)은 한약진흥재단 천연물물질은행 (Gyeongsan, Korea)으로부터 분양받아 사용하였으며 동시분석조건은 Table 2와 같다. 검량선 작성을 위해 nodakenin, decursin, decursinol angelate 표준품을 methanol에 녹여 200, 100, 50, 25, 12.5, 6.25 ㎍/㎖의 농도로 제조한 후 UPLC분석을 수행하였으며 면적에 대한 농도로 검량선을 작성하였다.
5. 통계분석
건중량, 수분율, 세포간극과 유용성분의 평균은 일원배치분산분석 (One-way ANOVA)과 Duncun’s Multiple Range Test (DMRT)로 유의수준 5% (p < 0.05)으로 검증하였으며, 분석한 데이터 값은 평균치 ±표준편차 (means ± SD)로 나타내었다. Micro-CT 촬영을 통해 도출된 지하부 유용성분 및 간극 특성과 건중량 및 유용성분 간의 상관관계 분석은 Spearman’s rank 방법으로 확인하였다. 또한 건중량에 따른 세포간극 특성간의 변화를 살펴보기 위해 회귀분석을 진행하였다. 모든 통계분석은 SAS (Statistical Analysis System ver. 7.1) software을 이용하였다.
결과 및 고찰
1. 건중량 및 수분율
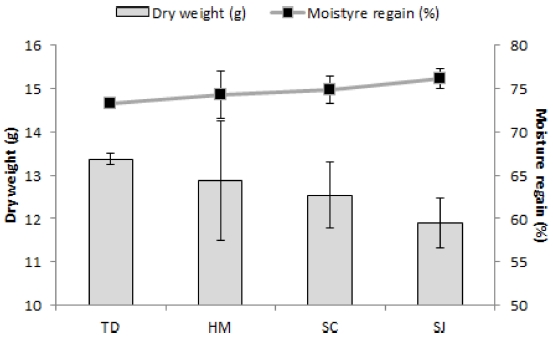
생체시료를 지역별 3 개체씩 생중량 50 ± 0.02 g으로 3 반복하여 건중량과 수분율을 분석한 결과 건중량은 TD (13.37 ± 0.13 g) > HM (12.87 ± 1.38 g) > SC (12.54 ± 0.77 g) > SJ (11.90 ± 0.57 g) 순으로 측정되었고, 수분량은 SJ (76.19 ± 1.13%) > SC (74.91 ± 1.55%) > HM (74.26 ± 2.75%) > TD (73.26 ± 0.25%) 순으로 측정되었다. 4 곳의 재배지 중 HM와 SC는 평균 건중량이 12.87 ± 1.38 g와 12.54 ± 0.88 g로 그 차이가 미미하였으나 TD는 앞선 두 지역의 건중량과 0.5 g와 0.83 g의 건중량 차이를 관찰하였고, 가장 낮은 건중량을 보인 SJ와는 1.47 g의 차이를 보였다. 또한 수분율에서 SJ와 TD간의 차이가 2.93%로 산출되었다 (Table 3, Fig. 2).

Dry weight derived after drying 50 g fresh weight and moisture regain of Angelica gigas roots in Pyeongchang. TD; TopDong-ri, HM; HoMyeong-ri, SC; SongJeong-ri, SJ; SangJinBu-ri. Each value is expressed as the means ± SD (n = 3). *Mean with same letters are not significantly different in Duncan’s Multiple Range Test (p < 0.05).
실험에 사용된 참당귀 (Angelica gigas Nakai) 시료는 기상조건의 영향을 제거하기 위해 평창지역으로 한정시키고, 별개의 재배지에서 동일한 날짜에 수집하여 사용하였다. 그 결과 50 ± 0.02 g의 생중량에 대해 가장 높은 건중량이 확인된 TD의 13.37 ± 0.13 g에서부터 가장 낮은 SJ의 11.90 ± 0.57 g까지 약 1.47 g의 차이를 확인하였다.
일반적으로 식물생장의 필수영양소 중 다량원소인 질소 (N)와 인 (P), 칼륨 (K)은 식물세포의 형성과 발육에 영향을 미치며 (Jung, 2015), 결핍 시 식물체 단백질 함량 감소, 세포분열 억제로 인한 뿌리발달 불량, 병해에 대한 저항성 감소 등을 초래한다 (Kim et al., 2014a). 즉 적정 유기질 비료의 사용은 참당귀 뿌리의 중량변화에 영향을 주며 (Kim et al., 2014c), 기타 토양 원소의 간섭으로 중량의 차이가 발생한다고 사료된다. 하지만 본 실험에서는 건중량과 micro-CT 촬영기법을 활용한 지하부 내 세포간극율의 상관관계 확인을 위한 실험이라 유기질 비료의 시비량 및 토양성분 분석은 수행되지 못했고 또한 건중량과의 상관관계를 확인하지 않았다. 추후 건중량 차이의 정확한 측정을 위해 유기질 비료 시비량과 토양성분에 따른 뿌리 중량의 차이에 대한 실험이 추가적으로 필요하다고 사료된다.
2. 뿌리 내 세포간극율 분석
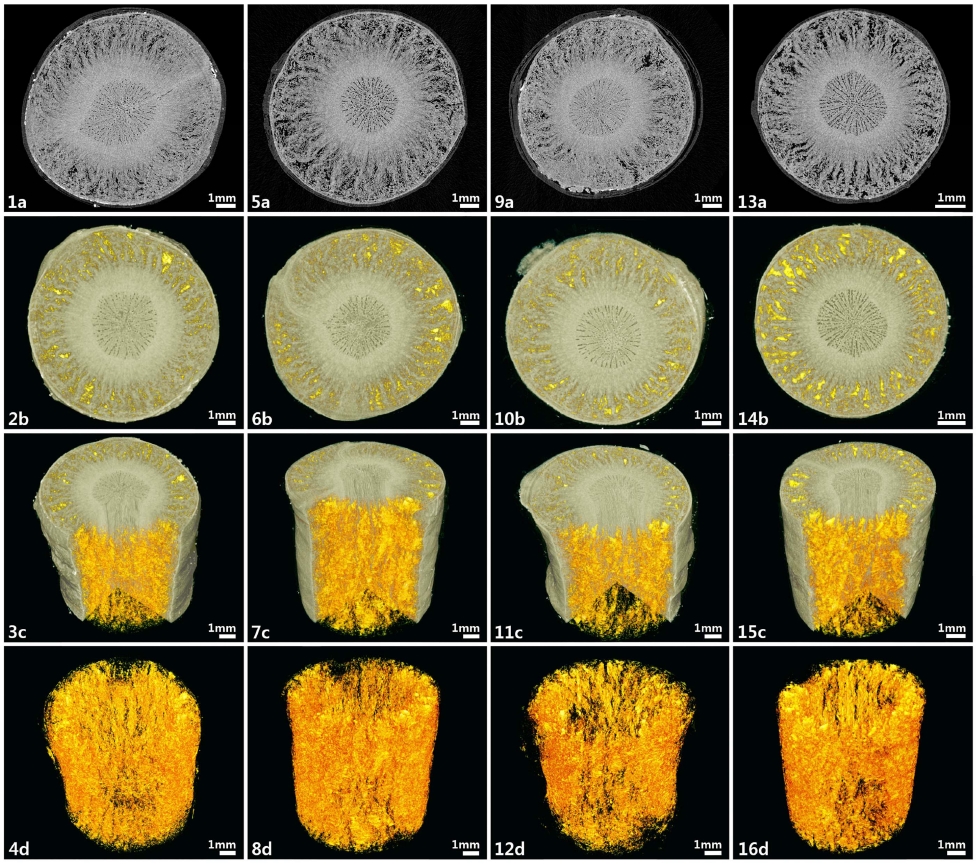
Micro-CT 촬영을 통해 참당귀의 뿌리의 간극부피는 TD는 71.95 ± 8.75 ㎣, HM은 72.98 ± 16.54 ㎣, SC는 69.55 ± 1.97 ㎣, SJ는 85.66 ± 16.88 ㎣로 산출되었으며 이를 각각의 전체 부피에 대한 간극부피 백분율로 확인한 결과 SJ (9.01 ± 2.15%) > HM (7.53 ± 1.64%) > SC (6.89 ± 0.16%) > TD (6.44 ± 0.76%) 순으로 관찰되었으며 4 곳의 재배지에서 가장 낮은 간극율을 보인 TD와 가장 높은 간극율을 보인 SJ는 2.57%의 차이가 있음을 확인하였다 (Table 4, Fig. 3).

Intercellular space of Angelica gigas roots in Pyeongchang. 1 - 4; TopDong-ri, 5 - 8; HoMyeong-ri, 9 - 12; SongJeong-ri, 13 - 16; SangJinBu-ri, a; micro-CT image, b; image analysis-plane, c; image analysis (side, matter and intercellular space), d; image analysis (side, intercellular space).
본 연구는 참당귀 지하부의 동일한 생중량에 대한 건중량과 피층에 위치하는 간극간의 상관관계를 구명하기 위하여 간극 부피의 정확한 정량화가 필요하였다. 따라서 기존에 사용되고 있는 파라핀을 이용한 식물조직의 관찰 (Ruzin, 1999)이나 일반적인 X-ray 투과 촬영 및 관찰 (Mathers et al., 2018; Sim et al., 2018)이 아닌 X-ray 단층 촬영을 통해 시료 내부를 영상화하고 영상의 픽셀을 이용하여 정확한 간극부피의 면적을 산출할 수 있는 micro-CT 촬영기기를 이용하였다. 그 결과 건중량이 가장 높은 TD에서 가장 낮은 간극율인 6.44 ± 0.76%가 관찰되었으며, 건중량이 가장 낮은 SJ에서 가장 높은 간극율인 9.01 ± 2.15%가 나타났다. 이는 앞서 서술한 세포간극 내에 점유하고 있는 여러 물질 중 공기나 이산화탄소 등의 기체가 아닌 수분이 점하고 있어 피층 내 세포간극의 총 면적이 건중량에 관여한다고 사료된다.
3. 유용성분 분석
UPLC 분석을 통한 참당귀 뿌리의 유용성분 함량을 조사한 결과 참당귀 뿌리의 유용성분 (nodakenin, decursin, decursinol angelate) 3가지 중 nodakenin의 검량선 방정식은 y = 28,955x + 192,000 (x =㎍/㎖, r2 = 0.997), decursin은 y = 36,839x + 326,989 (x =㎍/㎖, r2 = 0.991), decursinol angelate는 y = 32,930x + 117,156 (x =㎍/㎖, r2= 0.998)였다.
참당귀는 일반적으로 잎의 동화산물이 뿌리로 이동하여 축적되면서 지하부가 비대된다 (Park et al., 2019). 또한 지하부의 수분함량이 낮을수록 decursin과 decursinol angelate같은 유용성분의 함량이 높아진다고 보고되고 있는데 (Yoon et al., 2011; Park et al., 2019) 참당귀의 유용성분 중 nodakenin의 경우 SC에서 9.21 ± 1.74 ㎎/g로 가장 높게 확인되었으며, decursin은 TD에서 60.71 ± 6.72 ㎎/g, decursinol angelate는 HM에서 49.21 ± 7.55 ㎎/g로 확인되었다. 또한 nodakenin, decursin 및 decursinol angelate의 총 함량은 가장 낮은 수분율을 보인 TD에서 가장 높은 116.13 ± 9.53 ㎎/g의 함량을 확인하였으며, 가장 높은 수분율을 보인 SJ에서 가장 낮은 99.77 ± 23.23 ㎎/g의 함량을 확인하여 두 실험구의 유용성분 총 함량의 차이가 16.36 ㎎/g로 관찰되었다 (Table 5).
4. 통계분석
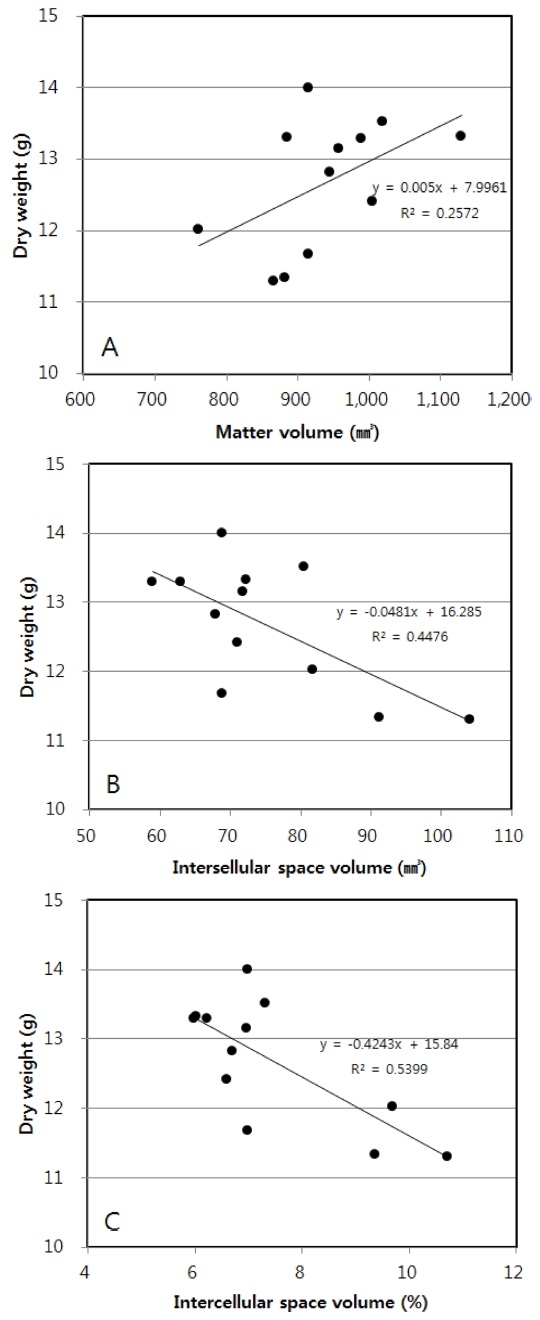
앞서 측정된 각각의 건중량, 세포간극 특성 및 유용성분간의 상관관계에 대한 통계적 유의성을 검정하기 위해 건중량과 세포간극 특성간의 회귀분석 (Fig. 4) 및 세포간극 특성과 유용성분간의 Spearman’s rank 상관관계분석을 수행한 결과는 Table 6, 7과 같다.

Graph of regression analysis of dry weight and matter characteristics. A; dry weight and matter volume (㎣), B; dry weight and intercellular space volume (㎣), C; dry weight and intercellular space volume (%).
건중량을 종속변수로 하고 물질부피, 간극부피 및 간극율을 각각의 독립변수로 할 때 건중량에 대한 물질부피는 유의적 상관관계를 확인할 수 없었으나 건중량이 클수록 물질의 부피 또한 상승하는 양의 상관관계로 분석되었다 (Fig. 4A). 하지만 건중량에 대한 간극 부피와 간극율은 높은 유의적 상관관계로 분석되었는데 건중량이 클수록 간극 부피나 간극율이 낮아지는 음의 상관관계를 보였다 (Fig. 4B, 4C). 또한 간극부피와 유용성분은 서로 음의 상관관계를 가지는 것으로 분석되었으며, nodakenin 함량과는 유의성 있는 음의 상관관계 (p < 0.016)를 보였다 (Table 7). 물질 부피는 decursinol angelate를 제외한 나머지 물질과 양의 상관관계를 보였고, 전체 부피는 모든 표준물질과 양의 상관관계를 보이는 것으로 확인되었다. 즉 참당귀의 건중량이 클수록 세포간극율이 낮아지는 음의 상관관계를 확인할 수 있었으며, 세포간극율과 유용성분 간의 상관관계 또한 세포간극율이 낮아질수록 유용성분이 높아지는 음의 상관관계를 확인할 수 있었다.
Acknowledgments
본 연구는 국립산림과학원 연구개발사업(과제번호: FG0502-2017-01)의 지원에 의해 이루어진 결과로 이에 감사드립니다.
REFERENCES
- Ahn MJ, Bae JY and Park JH. (2011). Pharmacognostical studies on the Angelica species from Korea. Korean Journal of Pharmacognosy. 42:1-4.
-
Buie HR, Campbell GM, Klinck RJ, MacNeil JA and Boyd SK. (2007). Automatic segmentation of cortical and trabecular compartments based on a dual threshold technique for in vivo micro-CT bone analysis. Bone. 41:505-515.
[https://doi.org/10.1016/j.bone.2007.07.007]

-
Burr-Hersey JE, Mooney SJ, Bengough AG, Mairhofer S and Ritz K. (2017). Developmental morphology of cover crop species exhibit contrasting behaviour to changes in soil bulk density, revealed by X-ray computed tomography. PLoS ONE. 12:e0181872. https://journals.plos.org/plosone/article?id=10.1371/journal.pone.0181872, (cited by 2019 May 15).
[https://doi.org/10.1371/journal.pone.0181872]

-
Dejaco A, Komlev VS, Jaroszewicz J, Swieszkowski W and Hellmich C. (2012). Micro CT-based multiscale elasticity of double-porous(pre-cracked) hydroxyapatite granules for regenerative medicine. Journal of Biomechanics. 45:1068-1075.
[https://doi.org/10.1016/j.jbiomech.2011.12.026]

-
Gainkam LOT, Huang L, Caveliers V, Keyaerts M, Hernot S, Vaneycken I, Vanhove C, Revets H, de Baetselier P and Lahoutte T. (2008). Comparison of the biodistribution and tumor targeting of two 99mTc-Labeled anti-EGFR nanobodies in mice, using pinhole SPECT/Micro-CT. Journal of Nuclear Medicine. 49:788-795.
[https://doi.org/10.2967/jnumed.107.048538]

- Geumsan Agricultural Technology Service Center(GATSC). (2005). Analysis of ginseng root growth using neutron radiography and visualization of water distribution in processed ginseng using neutron tomography. Geumsan Agricultural Technology Service Center. Geumsan, Korea. p.1-34.
- Geumsan Ginseng and Medicinal Crop Experiment Station (GGMCES). (2005). 3-dimentional visualization of ginseng root growth at main growth stage in soil using neutron tomography. Geumsan Ginseng and Medicinal Crop Experiment Station. Geumsan, Korea. p.1-35.
-
Jang CS and Oh BU. (2016). A taxonomic study of Korean Juncus based on the anatomical characters. Korean Journal of Plant Taxonomy. 46:392-404.
[https://doi.org/10.11110/kjpt.2016.46.4.392]

- Jeong HJ, Hong SY, Lee KY, Lee JH, Lim SH, Heo NK and Kim HY. (2015). Diabetic effect of Angelica gigas Nakai leaf extracts in diabetes mellitus type Ⅱ model mice by high fat-fed and streptozotocin-treated rats. Journal of Agricultural, Life and Environmental Sciences. 27:6-14.
- Jung YM. (2015). The function of nutrient. In the prevention and minerals for Korea agriculture in the future. Gomundang printing Inc., Daegu, Korea. p.101-117.
-
Karahara I, Yamauchi D, Uesugi K and Mineyuki Y. (2015). Three-dimensional imaging of plant tissues using X-ray micro-computed tomography. Plant Morphology. 27:21-26.
[https://doi.org/10.5685/plmorphol.27.21]

- Kim JW, Kim CH, Back JH, Lee DJ, Yong CS and Heo SS. (2014a). Introduction of soil fertilizer. Seonjinmunhwasa. Goyang, Korea. p.207-213.
-
Kim JY, Yoon YD, Ahn JM, Kang JS, Park SK, Lee K, Song KB, Kim HM and Han SB. (2007). Angelan isolated from Angelica gigas Nakai induces dendritic cell maturation through toll-like receptor 4. International Immunopharmacology. 7:78-87.
[https://doi.org/10.1016/j.intimp.2006.08.017]

- Kim SA, Oh HK, Kim JY, Hong JW and Cho SI. (2011). A review of pharmacological effects of Angelica gigas, Angelica sinensis, Angelica acutiloba and their bioactive compounds. Journal of Korean Oriental Medicine. 32:1-24.
- Kim YA, Park SH, Kim BY, Kim AH, Park BJ and Kim JJ. (2014b). Inhibitory effects on melanin production of demethylsubersin isolated from Angelica gigas Nakai. Korean Journal of Pharmacognosy. 45:209-213.
-
Kim YG, An TJ, Yeo JH, Hur M, Park YS, Cha SW, Song BH and Lee KA. (2014c). Effects of eco-friendly organic fertilizer on growth and yield of Angelica gigas Nakai. Korean Journal of Medical Crop Science. 22:127-133.
[https://doi.org/10.7783/KJMCS.2014.22.2.127]

-
Kwon JH, Han MS, Lee BM and Lee YM. (2015). Effect of Angelica gigas extract powder on progress of osteoarthritis induced by monosodium iodoacetate in rats. Analytical Science and Technology. 28:72-77.
[https://doi.org/10.5806/AST.2015.28.1.72]

- Lee MY, Im SH, Ju YS, Han HS, Jeong HJ, An DG, Kang HC and Ko BS. (2000). Discrimination of three Angelica species using the RAPDs and internal root structure. Korean Journal of Medical Crop Science. 8:243-249.
-
Lee SH, Shin DS, Kim JS, Oh KB and Kang SS. (2003). Antibacterial coumarins from Angelica gigas roots. Archibes of Pharmacal Research. 26:449-452.
[https://doi.org/10.1007/BF02976860]

- Lee TB. (2003). Coloured flora of Korea. Vol. 1. Hayangmunsa. Seoul, Korea. p.839-844.
- Lee YN. (2006). New flora of Korea. Vol. 1. Kyohak Publising Co. Seoul, Korea. p.810-832.
-
Mathers AW, Hepworth C, Baillie AL, Sloan J, Jones H, Lundgren M, Fleming AJ, Mooney SJ and Sturrock CJ. (2018). Investigating the microstructure of plant leaves in 3D with lab-based X-ray computed tomography. Plant Methods. 14:99. https://plantmethods.biomedcentral.com/track/pdf/10.1186/s13007-018-0367-7, (cited by 2019 June 3).
[https://doi.org/10.1186/s13007-018-0367-7]

-
Moon YJ and Jang SA. (2011). Quality characteristics of cookies containing powder of extracts from Angelica gigas Nakai. Korean Journal of Food and Nutrition. 24:173-179.
[https://doi.org/10.9799/ksfan.2011.24.2.173]

-
Nam HI and Baik TH. (2016). Inhibitory effects of Angelica gigas Nakai on ulcerative colitis in dSS-induced ICR Mice. Journal of Physiology and Pathology in Korean Medicine. 30:439-446.
[https://doi.org/10.15188/kjopp.2016.12.30.6.439]

-
Paquita VC, Gleasona SS and Kalluri UC. (2011). Monitoring plant growth using high resolution micro-CT images. Proceedings of SPIE-IS&T Electronic Imaging. 7877:78770W. (cited by 2019 May 19).
[https://doi.org/10.1117/12.876719]

- Park MJ, Kang SJ and Kim AJ. (2009a). Hypoglycemic effect of Angelica gigas Nakai extract in streptozotocin-induced diabetic rats. Korean Journal of Food and Nutrition. 22:246-251.
- Park SK, Hong SK, Kim HJ, Kim BY, Kim TG, Kang JS and Kim DU. (2009b). Cosmetic effect of Angelica gigas Nakai root extracts. Korean Chemical Engineering Research. 47:553-557.
- Park YM, Jeong DH, Sim SJ, Kim NH, Park HW and Jeon GS. (2019). The characteristics of growth and active compounds of Angelica gigas Nakai population in Mt. Jeombong. Korean Journal of Plant Resources. 32:9-18.
- Ruzin ES. (1999). Plant microtechnique and morphology. Oxford University Press. Oxford, England. p.127-128.
- Seo BI, Lee GH, Chol HY, Kwon DR and Boo YM. (2008). Chinese medicine herbalogy. Yeongnimsa. Seoul, Korea. p.851-857.
-
Sim CM, Seong BJ, Kim DW, Kim YB, Wi SG, Kim GI, Oh HS, Kim TJ, Chung BY, Song JY, Kim HG, Oh SK, Shin YD, Seok JH, Kang MY, Lee YH, Radebe MJ, Kardjilov N and Honermeier B. (2018). Continuous cropping of endangered therapeutic plants via electron beam soil-treatment and neutron tomography. Scientific Report. 8:2136. https://www.nature.com/articles/s41598-018-20124-7.pdf, (cited by 2019 May 20).
[https://doi.org/10.1038/s41598-018-20124-7]

-
Son SH, Kim MJ, Chung WY, Son JA, Kim YS, Kim YC, Kang SS, Lee SK and Park KK. (2009). Decursin and decursinol inhibit VEGF-induced angiogenesis by blocking the activation of extracellular signal-regulated kinase and c-Jun N-terminal kinase. Cancer Letters. 280:86-92.
[https://doi.org/10.1016/j.canlet.2009.02.012]

-
Song JH and Hong SP. (2012). Comparative anatomy of petiole in Forsythieae, Fontanesieae and Myxopyrum(Oleaceae) and its systematic implication. Korean Journal of Plant Taxonomy. 42:50-63.
[https://doi.org/10.11110/kjpt.2012.42.1.050]

- Sung JS, Bang KH, Park CH, Park CG, Yu HS, Park HW and Seong NS. (2004). Discrimination of Angelicae Radix based on anatomical characters. Korean Journal of Medical Crop Science. 12:67-72.
-
Torres-Ruiz JM, Jansen S, Choat SB, Mcelrone AJ, Cochard H, Brodribb TJ, Badel E, Burlett R, Bouche PS, Brodersen CR, Li S, Morris H and Delzon S. (2015). Direct X-ray microtomography observation confirms the induction of embolism upon xylem cutting under tension. Journal of Plant Physiology. 167:40-43.
[https://doi.org/10.1104/pp.114.249706]

-
Tuan HS and Hutmacher DW. (2005). Application of micro CT and computation modeling in bone tissue engineering. Computer Aided Design. 37:1151-1161.
[https://doi.org/10.1016/j.cad.2005.02.006]

-
Yoon MY, Kim YS, Choi GJ, Jang KS, Choi YH, Cha BJ and Kim JC. (2011). Antifungal activity of decursinol angelate isolated from Angelica gigas roots against Puccinia recondite. Research in Plant Disease. 17:21-31.
[https://doi.org/10.5423/RPD.2011.17.1.025]

- Yu HS, Jo JS, Park CH, Park CG, Sung JS, Park HW, Seong NS and Jin DC. (2003). Plant growth and bolting affected by transplanting time in Angelica gigas. Korean Journal of Medical Crop Science. 11:392-396.

