
버섯류의 비타민 B 복합체 조성 특성 분석 및 품질지표 후보 탐색: 다변량 분석 기반 군집화
This is an open access article distributed under the terms of the Creative Commons Attribution Non-Commercial License (http://creativecommons.org/licenses/by-nc/3.0/) which permits unrestricted non-commercial use, distribution, and reproduction in any medium, provided the original work is properly cited.
Abstract
This study evaluated the vitamin B complex (B1, B2, and B3) contentes in 17 cultivated mushroom species distributed in Korea using high-performance liquid chromatography. It also investigated the applicability of using B vitamins as quality indicators through multivariate statistical analysis.
The analytical method showed excellent linearity (R² ≥ 0.999), accuracy (recovery 97.7-100.2%), and precision (RSD ≤ 2.8%). Among the analyzed vitamins, total niacin showed the highest content, particularly in king oyster and oyster mushrooms. Heatmap and principal component analyses revealed distinct clustering patterns among mushroom species based on vitamin B composition, and total niacin was identified as a major variable contributing to species differentiation. In addition, total niacin exhibited a low relative expanded uncertainty in major mushroom samples, supporting the analytical reproducibility and applicability of its use as a potential quality marker compound.
Vitamin B composition patterns differ among cultivated mushroom species and total niacin may serve as a candidate quality marker for the compositional classification and quality assessment of mushrooms.
Keywords:
High Performance Liquid Chromatography, Multivariate Analysis, Mushrooms, Niacin, Principal Component Analysis, Candidate Quality Markers서 언
버섯은 약용작물학 분야에서 활용 가능한 기능성 생물자원으로서 오랫동안 식용 및 약용 소재로 이용되어 왔다. 일부 버섯은 다양한 생리활성 성분을 함유하는 것으로 보고되어 왔으며 (Wasser, 2002; Lindequist et al., 2005), 최근에는 기능성 식품 및 천연 소재로서의 활용 가능성이 지속적으로 연구되고 있다. 한편 버섯은 단백질, 식이섬유, 무기질뿐만 아니라 비타민 B군의 중요한 공급원으로 알려져 있으며 (Kalač, 2009), 종에 따라 비타민 조성 및 함량에 차이를 나타낸다. 비타민 B군은 에너지 대사와 세포 기능 유지에 필수적인 영양소로서, 버섯의 영양학적 특성과 품질 특성을 평가하는 데 중요한 지표가 될 수 있다. 따라서 버섯류의 비타민 B군 조성 특성을 비교하고 종 간 차이를 평가하는 것은 품질평가 및 영양적 가치 이해를 위한 중요한 기초자료가 된다.
우리나라에서는 1960년대 양송이버섯 재배가 시작된 이후 재배 기술이 고도화되었으며, 1980년대 이후 주요 농산물 수출 품목으로 성장하였다 (Yoo et al., 2005). 최근에는 산업적 확대와 더불어 버섯의 약리적 효능 및 기능성 성분에 대한 과학적 규명뿐만 아니라, 약용작물로서의 품질평가 및 표준화에 대한 필요성이 점차 증가하고 있다.
버섯의 기능성은 주로 다당류, 페놀성 화합물, 비타민 및 미량 영양소 등 다양한 생리활성 성분에 의해 발현되는 것으로 알려져 있다 (Ferreira et al., 2009). 특히 수용성 비타민인 비타민 B군은 체내 에너지 대사에 필수적인 조효소로 작용할 뿐만 아니라 (Dimopoulou et al., 2022), 세포 내 산화환원 반응 및 대사 항상성 유지에 중요한 역할을 수행한다 (Kennedy, 2016). 또한 니아신은 NAD+ 및 NADP+의 전구체로 작용하여 세포 에너지 생성과 밀접하게 연관되어 있으며, 리보플라빈과 티아민 역시 각각 산화환원 효소계 및 탄수화물 대사 과정에서 핵심적인 기능을 수행하는 것으로 보고되고 있다 (Kennedy, 2016). 비타민 B군은 식품의 영양학적 품질을 평가하는 주요 지표 중 하나로 활용되고 있으며, 특히 버섯류는 동물성 식품에 비해 상대적으로 높은 수준의 비타민 B군을 함유하는 것으로 알려져 있다 (Kalač, 2009). 최근에는 단순한 총 함량 평가를 넘어 개별 vitamer 조성과 함량 패턴을 이용하여 식품 원료의 영양학적 특성 및 품질 특성을 비교하려는 연구가 증가하고 있다. 따라서 비타민 B군 조성의 종 간 변이를 체계적으로 분석하는 것은 버섯류의 영양적 가치 평가뿐만 아니라 품질 특성 비교를 위한 객관적인 기초자료로 활용될 수 있다.
그러나 현재까지 국내외 버섯류에 대한 연구는 대부분 특정 성분의 정량 분석 또는 개별 기능성 평가에 국한되어 있으며, 다양한 비타민 성분을 통합적으로 분석하고 이를 기반으로 종 간 특성을 비교하거나 품질지표 및 품질지표 후보 성분 선정 가능성 평가에 관한 연구는 상대적으로 부족한 실정이다 (Furlani and Godoy, 2008). 특히 약용작물의 품질평가에 있어서는 단순한 함량 비교를 넘어 기능성 발현과 연계된 지표 성분을 설정하는 것이 중요하며, 이를 위해서는 복수의 성분 변이를 종합적으로 해석할 수 있는 분석 접근이 필요하다. 일반적으로 품질지표 후보 성분 (candidate quality marker)은 종 간 판별, 원료 선별 및 원료 규격화, 품질평가에 기여할 수 있는 가능성이 있는 대표 성분을 의미하며, 천연물 및 약용작물의 품질관리와 표준화 과정에서 중요한 기준으로 활용된다 (Alamgir, 2017; Kaggwa et al., 2023).
다변량 통계기법은 이러한 복합적인 성분 정보를 통합적으로 해석하여 주요 변동 요인을 도출하고, 시료 간 유사성과 차이를 체계적으로 구분할 수 있는 유용한 방법이다. 특히 주성분분석 (Principal Component Analysis, PCA)은 다수의 변수로 구성된 데이터를 축약하여 주요 변수를 도출하고, 종 간 특성을 시각적으로 분류하는 데 효과적인 도구로 활용되고 있다 (Abdi and Williams, 2010). 또한 군집분석 및 히트맵 분석을 병행함으로써 성분 간 상관관계 및 시료 간 군집 구조를 보다 명확하게 해석할 수 있다.
따라서 본 연구에서는 국내에서 재배 및 유통되는 버섯 17종을 대상으로 비타민 B1, B2 및 B3 함량을 HPLC 기반으로 정량 분석하고, 다변량 통계기법을 활용하여 종 간 영양학적 특성과 군집 구조를 규명하고자 하였다. 나아가 비타민 B군 조성 패턴이 버섯 종 간 영양학적 특성과 조성적 차이를 설명하는 데 활용될 수 있는지를 평가하고, 종 간 차이를 효과적으로 설명할 수 있는 후보 지표 성분의 가능성을 검토하고자 하였다.
재료 및 방법
1. 실험 재료
본 연구에 사용된 버섯 시료는 농촌진흥청 국립농업과학원 식생활영양과로부터 제공받았으며, 모두 종 (species) 수준에서 구분·관리된 시료를 사용하였다. 총 17종의 버섯 시료를 분석 대상으로 사용하였으며, 동충하초 (귀리), 동충하초 (번데기), 동충하초 (현미), 노루궁뎅이버섯, 아위버섯, 꽃송이버섯, 흰백목이버섯, 표고버섯, 만가닥버섯, 갈색양송이버섯, 큰느타리버섯, 목이버섯, 느타리버섯, 팽이버섯, 잎새버섯, 갈색팽이버섯 및 양송이버섯을 포함하였다. 본 연구는 품종 (cultivar) 간 비교가 아니라 종 (species) 간 비타민 B군 조성 특성을 비교하기 위한 목적으로 수행되었으며, 각 버섯 시료의 일반명과 학명 및 시료에 대한 설명은 Table 1에 제시하였다. 각 버섯 시료는 독립적으로 확보된 시료를 이용하여 3회 반복으로 분석하였다 (n = 3).

Mushroom samples used in this study.
버섯 시료는 -80℃ 초저온냉동기 (DF8510, deep freezer, Ilsin BioBase Co., Ltd., Yangju, Korea)에서 24시간 동결시킨 후 동결건조기 (FDS8512, freeze dryer, Ilsin BioBase Co., Ltd., Yangju, Korea)에서 72시간 동결 건조하였으며, 완전히 건조된 시료를 분쇄기 (Micro hammer cutter mill type-3, Culatti AG, Zurich, Switzerland)를 이용하여 균질화하였다. 분말 시료는 1.0 ㎜ 체를 통과시킨 후 밀봉하여 4℃에서 보관하며 분석에 사용하였으며 이하 모든 함량 결과는 동결건조된 분말 기준 (건물 기준, dry weight basis)으로 나타내었다.
2. 시약 및 표준물질
분석에 사용된 표준 시약인 thiamine hydrochloride, riboflavin-5′-adenosine diphosphate (FAD), riboflavin-5′-phosphate (FMN), riboflavin, nicotinic acid 및 nicotinamide와 이온쌍 시약으로 sodium 1-hexanesulfonate, 이동상의 pH를 일정하게 유지하기 위한 sodium phosphate monobasic은 Sigma-Aldrich Co. (St. Louis, MO, USA)에서 구매하였다. 또한 추출과 이동상 제조를 위해 methanol, acetonitrile water 및 triethylamine은 HPLC grade를 J. T. Baker Co. (Phillipsburg, NJ, USA)에서 구매하여 사용하였으며, acetic acid는 Daejung Chemicals and Metals Co. (Siheung, Korea)에서 구매하여 사용하였다.
3. 수용성 비타민 B군 추출
버섯 시료에 함유된 thiamine (vitamin B1), riboflavin (vitamin B2) 및 niacin (vitamin B3)의 정량을 위해, 수용성 비타민의 물리화학적 특성을 고려하여 효율적인 회수를 유도하는 방법으로 보고된 Kim 등 (2014)의 추출법을 적용하였다. 본 방법은 효소 처리 없이 용매 조성, 초음파 추출 및 가열 (또는 환류) 조건을 활용하여 시료 매트릭스로부터 수용성 비타민을 효과적으로 용출시키는 방식으로, 비타민 B군의 안정성을 유지하면서도 높은 추출 효율과 재현성을 확보할 수 있는 것으로 알려져 있다. 특히, 티아민과 니아신은 이온쌍 시약을 포함한 수용액에서 초음파 추출을 통해 회수하고, 리보플라빈은 고온 환류 조건에서 추출함으로써 각 비타민의 용해도 및 안정성 차이를 반영한 동시 분석이 가능하도록 설계된 방법이다 (Kim et al., 2014).
Vitamin B1 및 B3 (thiamine, niacin)의 경우, 균질화한 버섯 시료 1 g - 5 g을 50 ㎖ 원심분리관에 취한 후, 5 mM sodium 1-hexanesulfonate 용액 25 ㎖를 첨가하고 초음파 추출기 (JAC 4020, KODO Technical Research Co., Ltd., Hwaseong, Korea)를 이용하여 40℃에서 30분간 초음파 추출을 수행하였다. 이후 추출액을 Whatman No. 6 여과지 (GE Healthcare, Amersham, England)를 이용하여 여과한 후 여액을 5℃ 조건에서 10분간 21,124 × g으로 원심분리 (1730 MR, Gyrozen, Daejeon, Korea)하였고, 0.45 ㎛ syringe filter (polyvinylidene difluoride filter media, Whatman Inc., Maidstone, England)로 여과하여 HPLC 분석에 사용하였다.
Vitamin B2 (riboflavin)의 경우 균질화된 버섯 시료 1 g - 5 g에 초순수 증류수 50 ㎖를 첨가한 후, 80℃에서 30분간 환류 추출 (reflux extraction)을 수행하였다. 추출액은 실온으로 냉각 후 Whatman No. 6 여과지 (GE Healthcare, Amersham, England)를 이용하여 여과하였으며 여액을 5℃ 조건에서 10분간 21,124 × g으로 원심분리 (1730 MR, Gyrozen, Daejeon, Korea)하였고, 0.45 ㎛ syringe filter (polyvinylidene difluoride filter media, Whatman Inc., Maidstone, England)로 여과하여 HPLC 분석에 사용하였다.
버섯 matrix의 점성 성분에 의한 간섭을 최소화하기 위하여 모든 시료는 동일한 조건에서 원심분리 (5℃, 21,124 × g, 10분) 후 분석하였다. 원심분리 후에도 상등액의 점성이 높아 여과 또는 HPLC 주입이 어려운 경우에 한하여 동일 배수로 희석하여 분석하였다. 이러한 추가 처리는 사전에 설정된 기준에 따라 수행되었으며, 분석 대상 시료 간 비교 가능성을 유지하기 위하여 모든 시료에 동일 희석배수를 적용하였다. 또한 모든 추출 과정은 비타민의 광분해를 방지하기 위하여 차광 조건에서 수행하였다.
4. HPLC 분석 조건
버섯 시료에 함유된 thiamine 및 niacin의 함량을 정량적으로 분석하기 위하여 thiamine 및 niacin (nicotinic acid 및 nicotinamide)은 high performance liquid chromatography/diode array detector (HPLC/DAD)를 적용하였고, Agilent사의 1200 series (Agilent Technologies, Inc., Wilmington, DE, USA)를 사용하여 gradient elution system으로 분석을 진행하였다 (Table 2).
HPLC operating conditions for the determination of thiamine (vitamin B1), riboflavin (vitamin B2), and niacin (vitamin B3).
한편, riboflavin (FAD, FMN)의 경우 high performance liquid chromatography/fluorescence detector (HPLC/FLD)를 적용하였고 Agilent 사의 1200 series (Agilent Technologies, Inc., Wilmington, DE, USA)를 사용하여 isocratic elution system으로 분석하였다 (Table 2).
5. 검량선 및 정량
각 비타민 표준용액은 다양한 농도의 표준물질을 0.01 ㎍/㎖ - 20 ㎍/㎖ 농도 (thiamine, niacin은 0.1 ㎍/㎖ - 20 ㎍/㎖, riboflavin은 0.01 ㎍/㎖ - 10 ㎍/㎖)로 희석하여 조제한 후 분석한 후 검량선을 작성하였다. 모든 검량선의 결정계수 (R2)는 0.999 이상으로 확보하였다. 정량은 외부표준법 (external standard method)을 이용하여 수행하였고 각 시료의 HPLC peak 면적 값을 대입하고 아래의 식에 적용하여 각 분석 비타민의 함량을 계산하였다.
S : 시험용액에 함유된 비타민의 농도 (㎍/㎖)
a : 시험용액의 전체 용량 (㎖)
b : 시험용액의 희석배수
각 생물학적 반복 시료에 대하여 독립적인 시료 채취와 추출 및 분석을 수행하였으며 (n = 3), 결과는 평균값 ± 표준편차로 나타내었다.
6. Thiamine, riboflavin 및 niacin 분석법의 검증
Thiamine, riboflavin 및 niacin 분석법은 AOAC (2002) 검증 가이드라인에 따라 (Woollard and Indyk, 2002) 분석법의 정확성 (accuracy), 정밀성 (precision), 직선성 (linearity), 검출 한계 (limit of detection, LOD)와 정량한계 (limit of quantification, LOQ)를 측정하였다.
각 분석 성분의 표준 검량선을 작성한 후, 표준 검량선의 결정계수 (R2)를 검토하여 직선성을 확인하였다. 분석법의 선택성을 검토하기 위해 시료와 표준용액 크로마토그램의 분리 양상을 확인하였으며, 각 표준용액 피크의 Rs (peak resolution, 분리능), N (theoretical plates, 이론단수), HETP (height equivalent to a theoretical plate, 이론단 높이) 및 S (symmetry factor, peak 대칭성 / tail factor)을 확인하였다.
아울러 성분별 표준용액의 signal/noise의 비율 (S/N 비율)이 3이 될 때의 농도를 LOD (limit of detection, 검출한계), S/N 비율이 10이 될 때의 농도를 LOQ (limit of quantification, 정량한계)로 설정하여 분석 감도를 검토하였다.
분석법의 정확성은 미국 국립표준기술연구소 (National Institute of Standards and Technology, NIST; Gaithersburg, MD, USA)에서 제공하는 표준인증물질 (Standard Reference Material, SRM)인 SRM-3280, Multivitamin/Multielement tablets을 이용하여 평가하였다.
본 연구의 버섯 시료는 동결건조 분말 형태인 반면, SRM 3280은 정제 (tablet) 형태의 표준물질이므로, 두 시료의 물리적 특성 차이를 고려하여 전처리 과정을 구분하였다. 버섯 시료는 균질화된 동결건조 분말을 일정량 칭량하여 추출하였고, SRM 3280은 정제를 분쇄하여 균질화한 후 정밀하게 칭량하여 분석에 사용하였다. 비타민 B1 및 B3는 초음파 추출법으로, 비타민 B2는 환류 추출법으로 각각 전처리하였으며, 각 분석은 3회 반복 수행하였다.
SRM-3280은 시료와 동일한 분석 절차에 따라 3회 반복 분석하였으며, 또한 모든 분석 대상 성분은 표준물질과 동일한 머무름 시간 (retention time)을 기준으로 동정하였으며, 크로마토그램 상에서 인접 피크와의 분리 상태를 확인하였다. 분석 정확도는 NIST certificate에 제시된 인증값 또는 참고값과 본 연구에서 산출된 측정값을 비교하여 회수율로 평가하였다.
분석법의 정밀성 평가를 위한 QC (quality control) matrix로는 FAPAS (Food Analysis Performance Assessment Scheme) 프로그램에서 제공하는 비타민 B1, B2 및 B3를 포함한 수용성 비타민 함량이 보증되어 있어 정량적 검증이 가능한 시판 강화조제분유 (fortified infant formula)를 영국 환경식품농림부 산하 식품환경연구청 (Fera Science Ltd, Sand Hutton, England)으로부터 제공받아 대체 QC 물질로 사용하였다.
이는 적절한 CRM을 활용하기 어려운 경우 함량이 보증된 물질을 대체 QC 물질로 활용할 수 있다는 AOAC Appendix F (AOAC International, 2016) Annex E의 권고에 근거에 근거하였다. 정밀성 평가는 하루 동안 10회 반복 분석하여 repeatability (intra-day precision, RSDr)를 산출하고, 5일 동안 하루 3회씩 반복 분석하여 reproducibility (inter-day precision, RSDR)를 산출하였다. 각 정밀성 지표는 coefficient variation (CV, %)으로 나타내었다 (Jang et al., 2022).
7. 측정불확도 산출 및 상대확장불확도 평가
비타민 B군 분석 결과의 신뢰성을 정량적으로 제시하기 위하여, 본 연구에서 분석 대상으로 설정한 비타민 B군 성분인 thiamine, total riboflavin 및 total niacin에 대하여 확장불확도와 상대확장불확도를 산출하였다. 각 성분의 평균 함량은 3회 반복 분석값의 평균으로 제시하였으며, 반복 분석에 따른 표준편차를 이용하여 표준불확도 (experimental uncertainty, u)를 다음 식에 따라 계산하였다.
여기서 SD는 반복 분석의 표준편차, n은 반복 분석 횟수 (n = 3)를 의미한다. 확장불확도 (expanded uncertainty, U)는 U = k × u로 계산하였으며 Coverage factor (k)는 Student's t-distribution을 기반으로 결정하였으며, 반복 분석 횟수에 따른 자유도 (degree of freedom)와 95% 신뢰수준을 고려하여 적용하였다. 자유도 (df = 2)에서는 k = 4.30이 적용되었으며, 이는 제한된 반복수에서 신뢰구간을 보다 보수적으로 추정하기 위한 값이다.
상대확장불확도 (relative expanded uncertainty, Urel)는 확장불확도를 평균 함량으로 나누어 백분율로 환산하였다.
검출되지 않은 성분(ND)은 불확도 산출 대상에서 제외하였다. 본 연구에서 제시한 상대확장불확도는 반복 분석 변동성을 기반으로 한 실험적 불확도 평가값으로, 분석 결과의 재현성 및 품질지표 후보 가능성을 판단하기 위한 보조 지표로 활용하였다.
8. 통계처리
기본 통계와 주성분 그래프는 Microsoft사 (Washington, WA, USA)의 Office 365 Excel 프로그램을 이용하여 분석 결과를 독립적인 생물학적 3 반복 (n = 3)에 대한 평균과 표준편차 (means ± SD)를 구하였다. 또한 SPSS 23.0 (Statistics Package for the Social Science, SPSS Inc., Chicago, IL, USA) 프로그램을 사용하여 세 그룹 이상의 시료 간의 유의적 차이를 Duncan’s Multiple Range Test (DMRT)를 이용하여 5% 수준에서 검증하였다 (p < 0.05).
버섯 종의 비타민 B군 함량 패턴 비교 및 군집 분석은 Heatmapper Program (Wishart Research Group, University of Alberta, Edmonton, Canada)을 이용하여 수행하였다. 분석 변수로는 비타민 thiamine, total riboflavin 및 total niacin 함량값을 사용하였으며, 불검출 (Not Detected, ND) 값은 분석 전 0으로 대체하였고 그 외 결측값은 존재하지 않았다. 시료별 함량 패턴을 기준으로 한 비교를 위해 scale type은 row로 설정하여 z-score 표준화를 수행하였다. 군집 분석은 Pearson 상관계수를 거리척도 (distance metric)로, average linkage를 연결 방법 (linkage method)으로 적용하였으며, 군집화는 시료 (row) 방향에만 적용하였다. 최종 heatmap에서는 비타민 B군 함량 패턴의 시각적 비교에 초점을 두어 dendrogram은 제외하고 제시하였다.
주성분분석 (PCA)은 thiamine, nicotinic acid, nicotinamide, total niacin, FAD, FMN, riboflavin 및 total riboflavin을 변수로 사용하였다. 변수 간 분산 차이를 최소화하기 위하여 분석 전 각 변수는 Z-score 표준화 [(x−mean)/SD]를 적용하였다. 검출되지 않은 성분 (ND)은 해당 성분이 존재하지 않는 것으로 간주하여 0으로 대체하였으며, PCA 데이터셋에는 추가적인 missing value는 존재하지 않았다.
PCA는 Microsoft Excel Office 365 (Microsoft Corporation, Redmond, WA, USA)를 이용하여 표준화 데이터 행렬로부터 공분산 행렬을 계산하고, 고유값 (eigenvalue) 및 고유벡터 (eigenvector)를 산출한 후 주성분 점수 (principal component scores)를 계산하여 score plot과 loading plot을 작성하였다. Total niacin은 nicotinic acid와 nicotinamide의 합으로 계산되는 파생변수 (derived variable)이지만, 총 니아신 함량을 나타내는 영양학적 지표로 널리 사용되므로 분석에 포함하였다. 따라서 PCA 결과는 total niacin의 독립적 영향력보다는 전체 niacin 조성 특성을 반영하는 것으로 해석하였다.
결과 및 고찰
1. 17종 버섯의 비타민 B1, B2 및 B3 함량
17종 버섯의 비타민 B1, B2 및 B3 함량을 독립적인 생물학적 반복 3개를 기반으로 산출하고 분석한 결과 버섯 종별로 뚜렷한 변동성을 나타내었으며, 이는 기존 문헌에서 보고된 버섯류 비타민의 종 특이적 차이와 일치하는 경향을 나타내었다 (Furlani and Godoy, 2008; Kalač, 2009).
비타민 B1의 경우 0.000 ㎎/100 g - 0.553 ㎎/100 g 범위에서 분포하였으며, 표고버섯 (0.553 ㎎/100 g)과 양송이버섯 (0.536 ㎎/100 g)이 가장 높은 함량을 나타내었다 (Fig. 1, Table 3). 이 결과는 기존 보고된 (0.004 ㎎/100 g - 0.08 ㎎/100 g) 재배 버섯의 B1 함량 (Furlani and Godoy, 2008)보다 더 높은 수준으로 확인되었으며, 이러한 차이는 버섯의 품종 특성 및 재배 환경의 차이에 의한 것으로 판단된다. 반면 흰백목이버섯 (0.000 ㎎/100 g), 꽃송이버섯 (0.046 ㎎/100 g) 등은 극히 낮은 B1 함량을 나타내었으며 동충하초의 경우 배지에 따라 B1 함량이 크게 달라지는 양상이 확인되었고, 현미 배양체 (0.302 ㎎/100 g)가 가장 높은 함량을 나타내었다 (Fig. 1, Table 3).
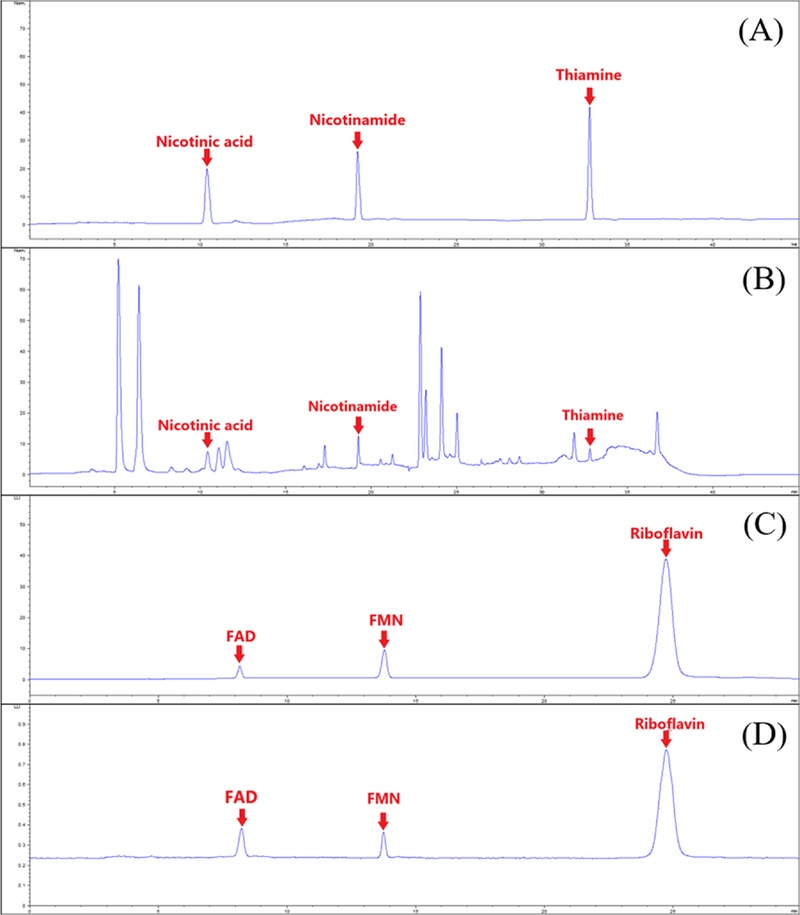
Representative HPLC chromatograms of vitamin B standards and mushroom extracts.(A); Standard mixture of thiamine (R.T. = 32.86 min), nicotinic acid (R.T. = 10.02 min), and nicotinamide (R.T. = 19.14 min), (B); representative mushroom extract (Awi mushroom extract) analyzed under the same chromatographic conditions, (C); standard mixture of riboflavin (R.T. = 24.91 min), FMN (R.T. = 13.92 min), and FAD (R.T. = 8.16 min), and (D); representative mushroom extract (Brown button mushroom extract) analyzed under riboflavin-specific chromatographic conditions.
Contents of thiamine (vitamin B1) and niacin vitamers (nicotinic acid and nicotinamide) in 17 mushroom species.
비타민 B2 함량은 0.032 ㎎/100 g - 0.349 ㎎/100 g의 범위를 나타내었으며, 양송이버섯이 가장 높은 함량을 나타내었으며 (0.349 ㎎/100 g), 이러한 결과는 양송이버섯에서 비타민 B2의 함량이 매우 높다는 기존의 연구 보고와 동일하였다 (Furlani and Godoy, 2008). 동충하초의 경우 번데기 배양체 (0.288 ㎎/100 g)가 가장 높은 함량을 나타낸 반면 목이버섯 (0.032 ㎎/100 g)과 백목이버섯 (0.053 ㎎/100 g)은 전체 분석 시료 중 가장 낮은 비타민 B2 함량을 나타내었다 (Fig. 1, Table 4).
Contents of riboflavin vitamers [flavin adenine dinucleotide (FAD), flavin mononucleotide (FMN), and riboflavin] in 17 mushroom species.
비타민 B3는 전체 비타민 B군 중 가장 높은 함량 비율을 나타내었으며, 그 범위는 0.094 ㎎/100 g에서 5.260 ㎎/100 g로 확인되었다 (Fig. 1, Table 3). 특히 큰느타리버섯 (5.260 ㎎/100 g)과 느타리버섯 (4.925 ㎎/100 g)은 매우 높은 니아신 함량을 나타내었고, 이는 일반적으로 버섯류에 비타민 계열 중에 니아신이 가장 풍부하게 함유되어있다는 Kalač (2009)의 보고와도 일치하였다. 반면 흰백목이버섯 (0.094 ㎎/100 g)과 목이버섯 (0.289 ㎎/100 g)은 매우 낮은 함량을 보였으며. 동충하초의 비타민 B3 함량은 0.757 ㎎/100 g - 1.260 ㎎/100 g으로 확인되어 버섯류 평균보다는 낮았으나, 배지 간 유의적인 차이가 확인되었으며 번데기를 배지로 활용하는 배양체가 가장 높은 함량을 나타내었다. 이러한 차이는 버섯 종, 재배 조건, 시료 처리 방식 및 분석법 차이에 기인할 수 있으며 (Xiao et al., 2004), 버섯류 비타민 조성이 종 및 생산 조건에 따라 달라질 수 있음을 시사한다.
표고버섯과 양송이버섯은 비타민 B1과 비타민 B2가 우수한 함량을 나타낸 반면, 비타민 B3의 경우 느타리 및 큰느타리버섯에서 매우 높은 함량을 나타내어 버섯의 종류별로 비타민 B군의 조성적 특성이 명확히 구분되는 것을 확인하였다.
2. 분석법 검증 및 측정불확도 평가
본 연구에서 사용한 HPLC 기반 비타민 B군 분석법은 직선성, 선택성, 검출한계, 정량한계, 정밀도 및 정확도를 통해 분석 성능을 검증하였다. 각 성분의 검량선은 분석 범위 내에서 우수한 직선성을 나타냈으며 (R2 ≥ 0.999), 검출한계 (LOD) 및 정량한계 (LOQ)는 ICH Q2(R2) 가이드라인 (ICH, 2023)에 따라 검량선의 기울기 (S)와 잔차 표준편차 (σ)를 이용하여 각각 LOD = 3.3σ/S, LOQ = 10σ/S로 산출하였다. 산출된 LOQ는 저농도 비타민 B군 분석에 적합한 수준이었으며, 회수율은 AOAC Appendix F (AOAC International, 2016)에서 제시하는 미량성분 분석의 허용기준 (80% - 110%)을 충족하였다 (Table 5).
Validation parameters and system suitability of the HPLC method for vitamin B analysis.
SRM-3280을 이용한 정확도 평가에서 thiamine, riboflavin 및 niacin의 회수율은 97.7% - 100.2% 범위를 나타내어 분석법의 정확성이 적절한 수준임을 확인하였다. 또한 NIST SRM 및 QC 시료 분석 결과가 기준 범위 내에 존재하여 분석법의 정확성과 정밀성이 확보되었음을 확인하였다. 반복정밀도 역시 intra-day 및 inter-day RSD가 낮은 수준으로 확인되어 본 분석법의 재현성이 우수함을 확인하였다 (Table 6).
Precision and accuracy validation of HPLC analysis for thiamine, riboflavin, and niacin using SRM 3280 and fortified infant formula.
이와 함께 본 연구에서는 분석 결과의 신뢰성을 보다 명확히 제시하기 위해 측정불확도 평가를 수행하였으며, 반복 분석 과정에서 발생하는 실험적 변동성을 기반으로 확장불확도 및 상대확장불확도를 산출하였다. 특히 본 연구에서는 반복 분석 기반 표준불확도에 포함계수 (k)를 적용하여 약 95% 신뢰수준의 확장불확도를 계산하였으며, 버섯-성분 조합별 포함계수는 2.00–4.30 범위로 나타났다 (Table 7).
Coverage factors for the estimation of expanded uncertainty based on repeated analysis of thiamine, niacin, and riboflavin vitamers in cultivated mushrooms.
대부분의 검출 성분에서 포함계수는 k = 2.00–2.78 범위에 분포하였으며 이는 해당 성분들의 반복 분석 결과가 비교적 안정적이며, 확장불확도 산출 시 일반적으로 적용되는 약 95% 신뢰수준의 포함계수와 유사한 수준임을 의미한다. 반면 일부 시료-성분 조합에서는 k = 3.18 또는 k = 4.30이 적용되었는데, 이는 Student's t-distribution에 기반하여 자유도와 신뢰수준을 고려한 coverage factor를 적용한 결과이다. 특히 저함량 성분의 경우 평균 함량이 낮아 동일한 절대 변동성이라도 상대확장불확도 (relative expanded uncertainty)가 상대적으로 크게 나타나는 경향을 보였다 (Table 7).
riboflavin, nicotinamide 또는 일부 flavin vitamer에서 높은 k 값이 관찰된 경우는 해당 성분의 함량이 낮거나 시료별 매트릭스 특성이 분석 변동성에 영향을 미쳤을 가능성을 시사한다. 따라서 본 연구에서 제시한 포함계수는 단순한 통계값이 아니라, 각 버섯-성분 조합에서 확장불확도 산출 시 어느 정도의 신뢰구간 보정이 필요한지를 보여주는 품질관리 지표로 해석할 수 있다.
실제 분석값의 신뢰구간 또는 불확도 크기를 직접적으로 판단하기 위하여 품질지표 후보 가능성을 평가하기 위해 선정한 대표 성분인 thiamine, total riboflavin 및 total niacin을 대상으로 평균 함량, 확장불확도 및 상대확장불확도를 산출하였다 (Table 8).
Expanded uncertainty estimated from repeated analyses of representative vitamin B components in selected cultivated mushrooms.
대표 성분의 상대확장불확도는 대부분 낮은 수준으로 나타났으며, total niacin뿐만 아니라 total riboflavin에서도 안정적인 분석 재현성이 확인되었다. 특히 total niacin의 경우 주요 고함량 시료인 큰느타리버섯과 느타리버섯에서 각각 약 0.5% 및 0.5% 이하로 산출되어 매우 안정적인 정량 결과를 보였다 (Table 8). 이는 total niacin이 버섯류의 종 간 차이를 설명하는 주요 변수일 뿐만 아니라, 분석 재현성 측면에서도 품질지표 후보로 활용 가능성이 높음을 의미한다.
한편 동충하초 (현미)의 thiamine은 상대확장불확도가 3.8%로 다른 대표 성분에 비해 다소 높게 산출되었다. 이는 해당 성분의 평균 함량이 0.302 ㎎/100 g으로 비교적 낮고, 반복 분석 표준편차가 상대적으로 크게 반영되었기 때문으로 판단된다. 일반적으로 저함량 성분에서는 작은 절대 변동도 평균값 대비 상대적으로 크게 계산될 수 있으므로, 상대확장불확도 해석 시 함량 수준을 함께 고려할 필요가 있다. 그러나 본 결과는 5% 미만의 범위에 해당하므로, 반복 분석 기반 재현성 측면에서 품질평가에 활용 가능한 수준의 분석 신뢰성을 갖는 것으로 확인되었다.
종합적으로, 본 연구에서 산출한 상대확장불확도는 비타민 B군 함량 자료의 분석 신뢰성을 정량적으로 보완하는 지표로 활용될 수 있으며, 특히 total niacin은 높은 함량, 낮은 상대확장불확도를 동시에 나타내어 품질지표 후보 성분으로서의 활용 가능성을 보여주었다.
3. 다변량 분석 기반 비타민 B군 조성 패턴 및 군집 분석
국내 재배 버섯의 비타민 B군 함량 특성을 종합적으로 비교하기 위하여 heatmap, 주성분분석 (Principal Component Analysis, PCA) 및 Pearson 상관관계로 다변량 분석을 수행하였다 (Fig. 2, 3, and 4) 다변량 분석은 개별 성분의 단순 비교를 넘어 분석 검체 간 함유 성분의 패턴과 변수 간 관계를 종합적으로 해석할 수 있는 효과적인 방법이다 (Abdi and Williams, 2010).
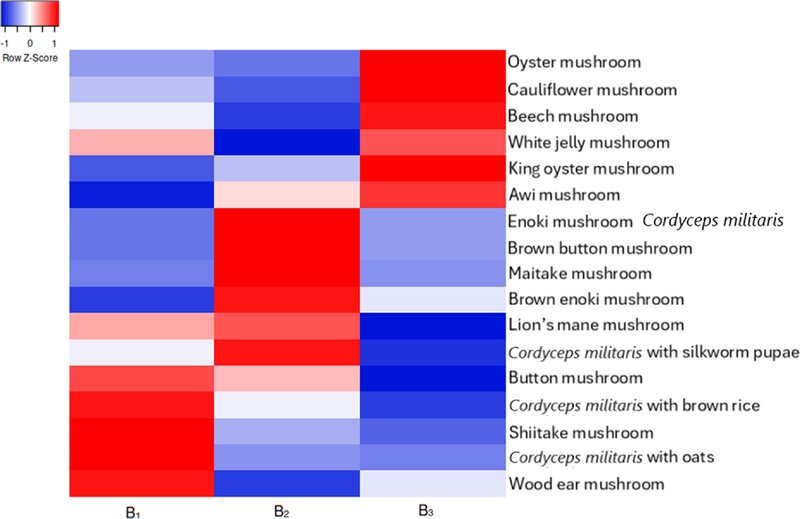
Heatmap visualization and hierarchical clustering of vitamin B complex composition in cultivated mushrooms.Heatmap analysis was performed to compare vitamin B composition patterns among cultivated mushroom species. The heatmap was generated using Z-score normalized total vitamin B1, B2, and B3 contents. Hierarchical clustering was conducted using Pearson distance and the average linkage method. ND values were replaced with zero prior to analysis. Red and blue colors indicate relatively high and low concentrations of vitamin B components, respectively. Mushrooms with high niacin (B3) contents, including oyster mushroom and king oyster mushroom, formed distinct compositional clusters, whereas mushrooms with relatively higher vitamin B1 or B2 contents exhibited separate clustering patterns. These results demonstrate that vitamin B composition patterns differ among mushroom species and contribute to compositional differentiation among cultivated mushrooms.
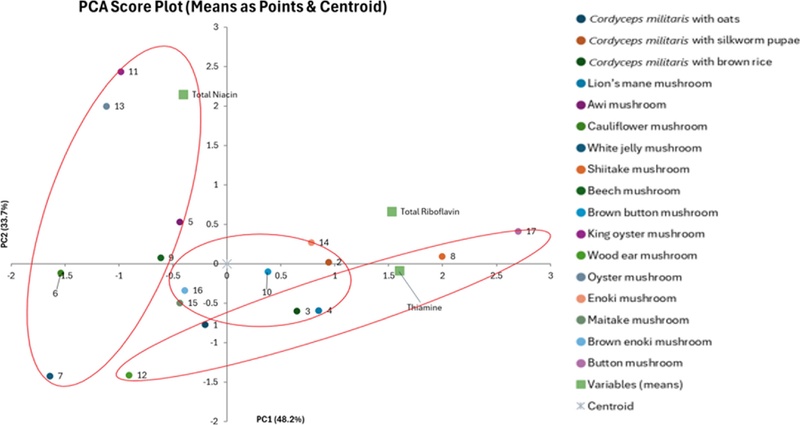
Principal component analysis (PCA) score and loading plots of vitamin B components in cultivated mushrooms.PCA was performed using Z-score normalized contents of thiamine, FAD, FMN, riboflavin, total riboflavin, nicotinic acid, nicotinamide, and total niacin in cultivated mushrooms. ND values were replaced with zero prior to analysis. Total niacin was included as a nutritionally relevant indicator representing the sum of nicotinic acid and nicotinamide. PC1 and PC2 explained 48.2% and 33.7% of the total variance, respectively, accounting for 81.9% of the cumulative variance. The loading plot indicated that niacin-related variables (total niacin, nicotinic acid, and nicotinamide) contributed substantially to species differentiation along PC1, reflecting overall niacin composition patterns among mushroom species, whereas riboflavin-related compounds contributed to compositional variation across both PC1 and PC2. Mushroom species with high niacin contents, including oyster and king oyster mushrooms, formed distinct compositional clusters, suggesting that vitamin B3 may be useful as a candidate quality marker for explaining compositional differences among mushroom species.
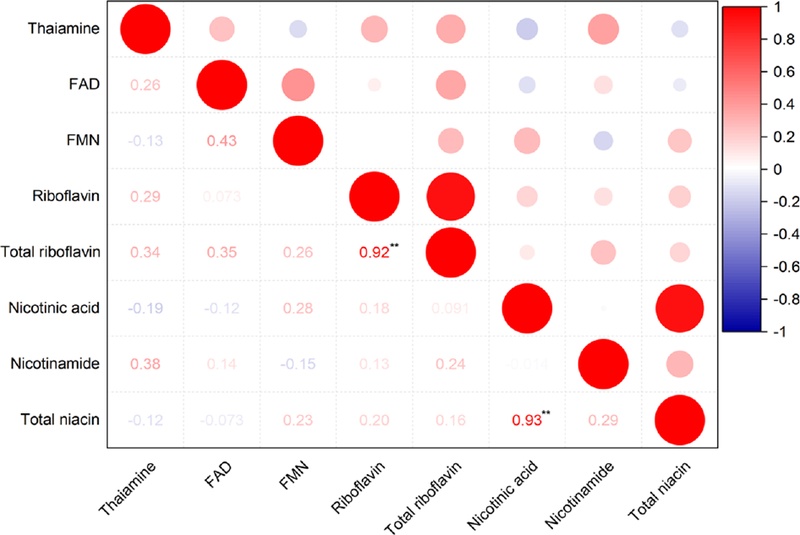
Pearson’s correlation matrix of vitamin B components in cultivated mushrooms.The correlation matrix was generated based on Pearson’s correlation coefficients among vitamin B components in cultivated mushrooms. Circle size and color intensity indicate the strength of correlation, with red and blue representing positive and negative correlations, respectively. Total riboflavin showed a strong positive correlation with riboflavin (r = 0.92, p < 0.01), while total niacin exhibited a strong positive correlation with nicotinic acid (r = 0.93, p < 0.01). These results suggest that specific vitamers predominantly contribute to total vitamin contents and may contribute to explaining compositional differences among mushroom species.
Heatmap 분석 결과 (Fig. 2), 버섯 종에 따라 비타민 B1, B2 및 B3 함량 패턴이 뚜렷하게 구분되는 군집 구분의 경향이 관찰되었다. 특히 느타리버섯 (Oyster mushroom), 큰느타리버섯 (King oyster mushroom) 및 꽃송이버섯 (Cauliflower mushroom)은 높은 비타민 B3 함량을 기반으로 유사한 군집을 형성하였으며, 반대로 동충하초 (Cordyceps militaris) 및 일부 갈색계 버섯류는 상대적으로 높은 비타민 B1 또는 비타민 B2 함량 특성을 나타내었다. 특히 동충하초의 경우 동일 균사체임에도 불구하고 귀리 및 현미 배지를 이용한 배양체에서는 상대적으로 높은 비타민 B1 함량이 관찰된 반면, 번데기 배지에서는 다른 비타민 성분이 상대적으로 높게 나타나는 경향이 확인되었다. 이는 버섯 종 고유의 대사 특성과 함께 배양 환경의 영향을 반영하는 것으로 판단되며 배지 조성 및 배양 조건이 동충하초의 생리활성 물질 생성에 중요한 영향을 미친다는 선행 연구 (Feng et al., 2018; Wu et al., 2022)와도 유사하였다. 결론적으로 버섯 종에 따라 vitamin B composition pattern이 서로 다르게 나타나며, 이러한 조성적 차이가 군집 형성에 반영됨을 시사한다.
Heatmap 분석은 total vitamin B1, B2 및 B3 함량 데이터를 이용하여 수행되었으며, Z-score normalization을 통해 표준화된 값을 기반으로 버섯 종 간의 전반적인 조성 패턴과 군집 특성을 시각적으로 비교하였다. Pearson distance와 average linkage method를 적용한 계층적 군집 분석 결과, 버섯 종들은 비타민 B군 조성에 따라 서로 다른 군집을 형성하였다. 반면 PCA는 thiamine, FAD, FMN, riboflavin, total riboflavin, nicotinic acid, nicotinamide 및 total niacin을 포함한 표준화된 (Z-score normalized) 데이터셋을 이용하여 수행하였으며, 버섯 종 간 분리에 기여하는 주요 비타민 조성 특성을 보다 세부적으로 평가하고자 하였다. 이러한 다변량 접근은 단순 함량 비교만으로는 확인하기 어려운 종 특이적 비타민 조성 패턴과 조성적 유사성을 평가하는 데 유용하며, 버섯 종 간 특성 비교와 품질지표 후보 성분 탐색을 위한 기초자료로 활용될 수 있다.
버섯 종 간 분리에 기여하는 주요 성분을 보다 세부적으로 평가하기 위하여 PCA를 수행한 결과 (Fig. 3), 제1주성분 (PC1)과 제2주성분 (PC2)은 각각 전체 변동의 48.2% 및 33.7%를 설명하여 총 81.9%의 높은 누적 설명력을 나타내었다. 이는 분석된 vitamin B composition이 버섯 종 간 조성적 차이를 설명하는 주요 변수임을 의미한다 (Jolliffe and Cadima, 2016).
Loading plot 결과, total niacin, nicotinic acid 및 nicotinamide와 관련된 niacin composition variables는 PC1 방향에서 상대적으로 높은 loading 값을 나타내어 버섯 종 간 조성 차이를 설명하는 주요 변수로 확인되었다. 다만 total niacin은 nicotinic acid와 nicotinamide의 합으로 계산되는 파생변수 (derived variable)이므로, 해당 결과는 total niacin 자체의 독립적인 영향력이라기보다는 전체 niacin 조성 패턴을 반영하는 것으로 해석하였다. 반면 riboflavin-related compounds는 PC1과 PC2 전반에 분포하여 버섯 종 간 조성 차이를 보조적으로 설명하는 경향을 나타내었다. 따라서 PCA 결과는 niacin-related variables가 버섯 종 간 조성적 분리에 중요한 역할을 함을 보여주며, 특히 total niacin이 버섯류의 조성 특성을 설명하는 대표 변수 중 하나임을 시사한다. 실제로 PCA score plot에서는 느타리버섯과 큰느타리버섯이 다른 버섯 종들과 구별되는 위치에 분포하였으며, 이는 높은 total niacin 함량과 관련된 조성 특성을 반영하는 것으로 해석된다. 반면 표고버섯과 양송이버섯은 상대적으로 높은 thiamine 및 riboflavin 함량 특성에 의해 별도의 군집을 형성하였다. 이러한 결과는 버섯 종 간 비타민 B군 조성 패턴의 차이가 다변량 분석을 통해 효과적으로 구분될 수 있음을 보여준다.
PCA score plot에서는 비타민 B3의 함량이 높은 버섯 종들이 PC2 방향 상단에 분포하는 특징적인 군집을 형성하였다. 이는 히트맵에서 비타민 B3 농도가 높은 군집과 동일한 패턴을 나타내는 것이며, 두 다변량 분석법이 서로 다른 통계적 방법을 이용하였음에도 유사한 결과를 나타내고 있음을 보여준다. 이 결과로 볼 때 히트맵 분석은 개별 성분의 상대적 농도를 직관적으로 시각화하는 반면, PCA 분석은 이러한 패턴을 통계적으로 요약하여 변수 간 관계와 종 간 분리를 설명한다는 점에서 (Abdi and Williams, 2010) 상호 보완적인 역할을 수행함을 알 수 있었다.
이러한 결과는 버섯 종들이 비타민 B군 조성 패턴에 따라 서로 다른 특성을 나타냄을 보여주며, 비타민 B군 조성이 버섯 종 간 조성적 차이를 비교·평가하는 데 유용한 정보가 될 수 있음을 시사한다. 특히 니아신은 NAD+ 및 NADP+의 전구체로 작용하여 세포 에너지 대사 및 산화환원 반응에 중요한 역할을 수행하는 것으로 알려져 있다 (Kennedy, 2016). 또한 리보플라빈은 FMN 및 FAD의 구성 성분으로서 전자전달계와 산화환원 효소계에 관여하며, 티아민은 탄수화물 대사 과정에서 조효소로 작용하는 필수 영양소이다 (Bacher et al., 2000). 따라서 비타민 B군은 단순한 영양성분을 넘어 식품 원료의 영양학적 품질을 평가하는 주요 지표로 활용될 수 있으며, 버섯 종 간 비타민 B군 조성 차이를 비교하는 것은 영양적 특성과 품질 특성을 이해하는 데 유용한 정보를 제공할 수 있다.
또한 Pearson 상관관계 분석 (Fig. 4) 결과, total riboflavin은 FAD 및 FMN과는 비교적 낮은 상관성을 보였으나, riboflavin과 높은 양의 상관관계 (r = 0.92, p < 0.01)를 나타냈으며, total niacin은 nicotinic acid와 높은 상관관계 (r = 0.93, p < 0.01)를 나타내었다. 이는 total riboflavin 함량이 주로 riboflavin 성분의 함량에 의해 영향받으며 total niacin 함량은 nicotinic acid 함량의 변화에 의존한다는 것을 알 수 있었다. 이는 total niacin이 nicotinic acid와 nicotinamide로부터 계산되는 파생변수임을 반영하는 결과로 해석된다. 이러한 결과는 특정 vitamer가 vitamin B composition variation에 크게 기여함을 의미하며, total niacin 및 total riboflavin이 버섯 종 간 조성적 차이를 설명하는 후보 지표 성분으로 활용될 가능성을 시사한다.
특히 동충하초는 동일 종임에도 배지 조성 (귀리, 현미, 번데기)에 따라 PCA 상 서로 다른 위치에 분포하였다. 이는 재배 조건 변화가 vitamin B composition에 영향을 미칠 수 있음을 시사한다.
본 연구에서 total niacin은 세 가지 측면에서 품질지표 후보 성분으로서의 활용 가능성을 보였다. 첫째, 전체 분석 비타민 B군 중 가장 높은 함량 범위와 뚜렷한 종 간 변이를 나타내어 버섯류의 조성적 차이를 설명하는 데 유리하였다. 둘째, PCA 및 heatmap 분석에서 niacin-related composition pattern이 느타리버섯 및 큰느타리버섯의 분리에 크게 기여하여 종 간 조성적 판별력이 확인되었다. 셋째, 상대확장불확도 분석에서 주요 고함량 시료의 total niacin은 낮은 분석 변동성을 보여 정량 재현성 측면에서도 안정적인 지표로 판단되었다. 이러한 결과는 품질지표 후보 성분이 단순히 함량이 높은 성분이 아니라, 시료 간 변별력, 안정적인 정량 재현성 및 원료 규격화 적용 가능성을 함께 충족해야 한다는 천연물 품질관리 개념과도 부합한다 (Noviana et al., 2022; Kaggwa et al., 2023). 본 연구에서 total niacin은 높은 종 간 변이, PCA에서 관찰된 niacin composition pattern에 대한 기여도 및 낮은 상대확장불확도를 동시에 나타내어, 버섯류 품질평가를 위한 유망한 품질지표 후보 성분 (candidate quality marker)으로서의 활용 가능성을 보여주었다.
본 연구에서는 NIST SRM-3280과 FAPAS® fortified infant formula를 이용하여 분석법의 정확성과 재현성을 검증하였다. 비타민 B군의 회수율은 97.7% - 100.2% 범위를 나타내어 분석법의 신뢰성이 확보되었음을 확인하였다.
다만 matrix effect를 직접 평가하기 위한 post-extraction spike 실험이나 peak purity를 확인하기 위한 PDA 기반 스펙트럼 분석은 수행하지 않았다. 따라서 향후 버섯 matrix에 대한 matrix-matched calibration, spike recovery 및 peak purity 평가를 포함한 추가적인 분석법 검증이 수행된다면 분석법의 선택성과 정확성을 보다 엄밀하게 확인할 수 있을 것으로 판단된다.
또한 본 연구는 국내 재배 버섯의 비타민 B군 함량을 단순 정량 분석하는 기존 연구들과 달리, 다변량 통계기법을 기반으로 비타민 B군 조성 패턴을 종합적으로 해석하고 이를 비타민 B군 조성 특성과 연계하여 버섯 종 간 군집 구조를 규명하였다는 점에서 차별성을 가진다. 특히 heatmap, PCA 및 상관관계 분석을 통합적으로 적용함으로써, 비타민 B군 조성이 버섯의 종 특이적 대사 특성과 조성적 차이를 반영하는 중요한 변수임을 확인하였으며, 특정 비타민 성분이 버섯 종 간 조성적 차이를 설명하는 후보 변수로 활용될 가능성을 제시하였다.
기존의 버섯 영양성분 연구는 주로 개별 성분의 함량 비교나 특정 기능성 평가에 초점을 두어 왔으나, 본 연구에서는 비타민 B군 조성을 기반으로 버섯 종 간 vitamin B composition의 차이를 체계적으로 비교할 수 있는 가능성을 제시하였다. 특히 니아신 중심의 군집 형성은 버섯 종 간 조성적 차이를 설명하는 주요 패턴을 보여주었으며, 이는 향후 재배 조건과 비타민 조성 간 관계를 평가하기 위한 기초자료로 활용될 수 있다. 또한 동일 종에서도 배양 조건에 따라 비타민 조성이 변화하는 결과는 재배 환경 제어를 통해 vitamin B composition 변화에 영향을 줄 수 있음을 시사한다.
비타민 B군은 식품 영양표시와 영양성분 데이터베이스 구축에 활용되는 대표적인 수용성 비타민으로서, 품목 간 영양학적 차이를 객관적으로 비교할 수 있는 중요한 지표이다. 따라서 본 연구에서 제시한 비타민 B군 조성 정보는 버섯류의 영양학적 가치 평가뿐 아니라 품질관리 및 원료 특성 비교를 위한 기초자료로 활용될 수 있다.
산업적 측면에서 본 연구 결과는 약용 버섯의 품질 표준화 및 특정 목적 성분 함유 식품 소재 개발에 중요한 기초자료로 활용될 수 있다. 특히 비타민 B군 기반의 품질지표 후보 성분 설정은 복수 성분의 통합 분석 결과를 바탕으로 대표 성분 중심의 품질관리에 도움을 줄 수 있는 가능성을 제시하였으며, 원료의 규격화 및 고부가가치 소재 선별에 참고자료로 활용될 수 있을 것으로 판단된다. 또한 재배 조건에 따른 성분 변이 특성은 향후 재배 환경과 vitamin B composition 간 관계를 연구하기 위한 참고자료가 될 수 있다.
본 연구는 국내 재배 버섯류의 비타민 B군 조성 특성을 비교하고 종 간 차이를 체계적으로 평가하기 위한 기초자료를 제공하였다는 점에서 의의가 있다. 특히 total niacin은 분석 대상 버섯 종 간 조성 차이를 설명하는 주요 변수로 확인되어 품질평가를 위한 후보 지표 성분으로서의 활용 가능성을 보여주었다고 판단된다. 다만 본 연구는 제한된 시료와 반복 분석 자료를 기반으로 수행되었으므로, total niacin을 버섯류의 품질지표로 활용하기 위해서는 품종, 재배지, 수확시기, 저장조건 및 연차 변이에 따른 추가적인 검증 연구가 필요할 것으로 판단된다.
Acknowledgments
본 연구는 농촌진흥청 국립농업과학원의 연구사업(RS-2023-00229794)의 지원으로 수행되었으며, 이에 감사드립니다.
References
-
Abdi H and Williams LJ. (2010). Principal component analysis. Wiley Interdisciplinary Reviews: Computational Statistics. 2:433-459.
[https://doi.org/10.1002/wics.101]

-
Alamgir ANM. (2017). Herbal drugs: Their collection, preservation, and preparation; evaluation, quality control, and standardization of herbal drugs. In Therapeutic use of medicinal plants and their extracts: Volume 1: Pharmacognosy. Springer International Publishing. Cham. Switzerland. p.453-495.
[https://doi.org/10.1007/978-3-319-63862-1_10]
- Association of Official Analytical Communities(AOAC) International. (2016). Appendix F: Guidelines for standard method performance requirements, Annex E: AOAC method accuracy review. In Official methods of analysis of AOAC International(20th eds.). Association of Official Analytical Communities International. Rockville. MD, USA. p.15.
-
Bacher A, Eberhardt S, Fischer M, Kis K and Richter G. (2000). Biosynthesis of vitamin B2(riboflavin). Annual Review of Nutrition. 20:153-167.
[https://doi.org/10.1146/annurev.nutr.20.1.153]
-
Dimopoulou M, Kolonas A, Mourtakos S, Androutsos O and Gortzi O. (2022). Nutritional composition and biological properties of sixteen edible mushroom species. Applied Sciences. 12:8074. https://www.mdpi.com/2076-3417/12/16/8074?cp=4252247357&0&cp=4252247357&5, (cited by 2026 Mar 1).
[https://doi.org/10.3390/app12168074]
-
Feng YJ, Zhu Y, Li YM, Li J, Sun YF and Shen HT. (2018). Effect of strain separated parts, solid-state substrates and light condition on yield and bioactive compounds of Cordyceps militaris fruiting bodies. CyTA- Journal of Food. 16:916-922.
[https://doi.org/10.1080/19476337.2018.1498130]
-
Ferreira IC, Barros L and Abreu RM. (2009). Antioxidants in wild mushrooms. Current Medicinal Chemistry. 16:1543-1560.
[https://doi.org/10.2174/092986709787909587]
-
Furlani RPZ and Godoy HT. (2008). Vitamins B1 and B2 contents in cultivated mushrooms. Food Chemistry. 106:816-819.
[https://doi.org/10.1016/j.foodchem.2007.06.007]
- International Council for Harmonisation of Technical Requirements for Pharmaceuticals for Human Use(ICH). (2023). Validation of analytical procedures: Text and methodology Q2(R2). International Council for Harmonisation of Technical Requirements for Pharmaceuticals for Human Use. Geneva, Switzerland. chrome-extension://efaidnbmnnnibpcajpcglclefindmkaj/https://database.ich.org/sites/default/files/ICH_Q2(R2)_Guideline_2023_1130.pdf, (cited by 2026 Jun 2).
-
Jang Y, Jeon J, Lee SH, Choi YM and Choung MG. (2022). Evaluation of the vitamin B content of edible insects. Journal of the Korean Society of Food Science and Nutrition. 51:1223-1231.
[https://doi.org/10.3746/jkfn.2022.51.11.1223]
-
Jolliffe IT and Cadima J. (2016). Principal component analysis: A review and recent developments. Philosophical Transactions of the Royal Society A: Mathematical, Physical and Engineering Sciences. 374:20150202. https://pubmed.ncbi.nlm.nih.gov/26953178/, (cited by 2026 Mar 21).
[https://doi.org/10.1098/rsta.2015.0202]
-
Kaggwa B, Anywar G, Munanura EI, Wangalwa R, Kyeyune H, Okella H, Kamba FP and Engeu OP. (2023). Application of the herbal chemical marker ranking system(Herb MaRS) to the standardization of herbal raw materials: A case study. BMC Complementary Medicine and Therapies. 23:348. https://link.springer.com/article/10.1186/s12906-023-04178-3, (cited by 2026 Jun 14).
[https://doi.org/10.1186/s12906-023-04178-3]
-
Kalač P. (2009). Chemical composition and nutritional value of European species of wild growing mushrooms: A review. Food Chemistry. 113:9-16.
[https://doi.org/10.1016/j.foodchem.2008.07.077]
-
Kennedy DO. (2016). B vitamins and the brain: Mechanisms, dose and efficacy - A review. Nutrients. 8:68. https://www.mdpi.com/2072-6643/8/2/68?uid=eb59fe26s16, (cited by 2026 Mar 1).
[https://doi.org/10.3390/nu8020068]
-
Kim GP, Lee J, Ahn KG, Hwang YS, Choi Y, Chun J, Chang WS and Choung MG. (2014). Differential responses of B vitamins in black soybean seeds. Food Chemistry. 153:101-108.
[https://doi.org/10.1016/j.foodchem.2013.12.047]
-
Lindequist U, Niedermeyer TH and Jülich WD. (2005). The pharmacological potential of mushrooms. Evidence‐Based Complementary and Alternative Medicine. 2:285-299.
[https://doi.org/10.1093/ecam/neh107]
-
Noviana E, Indrayanto G and Rohman A. (2022). Advances in fingerprint analysis for standardization and quality control of herbal medicines. Frontiers in Pharmacology. 13:853023. https://www.frontiersin.org/journals/pharmacology/articles/10.3389/fphar.2022.853023/full, (cited by 2026 Apr 4).
[https://doi.org/10.3389/fphar.2022.853023]
-
Wasser SP. (2002). Medicinal mushrooms as a source of antitumor and immunomodulating polysaccharides. Applied Microbiology and Biotechnology. 60:258-274.
[https://doi.org/10.1007/s00253-002-1076-7]
-
Woollard DC and Indyk HE. (2002). Rapid determination of thiamine, riboflavin, pyridoxine, and niacinamide in infant formulas by liquid chromatography. Journal of AOAC International. 85:945-951.
[https://doi.org/10.1093/jaoac/85.4.945]
-
Wu CY, Liang CH and Liang ZC. (2022). Enhanced production of fruiting bodies and bioactive compounds of Cordyceps militaris with grain substrates and cultivation patterns. Journal of the Taiwan Institute of Chemical Engineers. 132:104138. https://www.sciencedirect.com/science/article/pii/S187610702100626X, (cited by 2026 Mar 21).
[https://doi.org/10.1016/j.jtice.2021.11.005]
-
Xiao JH, Chen DX, Liu JW, Liu ZL, Wan WH, Fang N, Xiao Y, Qi Y and Liang ZQ. (2004). Optimization of submerged culture requirements for the production of mycelial growth and exopolysaccharide by Cordyceps jiangxiensis JXPJ0109. Journal of Applied Microbiology. 96:1105-1116.
[https://doi.org/10.1111/j.1365-2672.2004.02235.x]
- Yoo YB, Kong WS, Oh SJ, Cheong JC, Jang KY and Jhune CS. (2005). Trends of mushroom science and mushroom industry. Journal of Mushroom Science and Production. 3:1-23.