
복분자·구기자·삼지구엽초 복합 추출물의 항산화 및 미백 시너지 효과
This is an open access article distributed under the terms of the Creative Commons Attribution Non-Commercial License (http://creativecommons.org/licenses/by-nc/3.0/) which permits unrestricted non-commercial use, distribution, and reproduction in any medium, provided the original work is properly cited.
Abstract
This study investigates the synergistic antioxidant and skin-whitening effects of Rubus coreanus, Lycium chinense, and Epimedium koreanum co-extracts to develop functional cosmetic ingredients.
Single extracts and co-extracts at various ratios were analyzed for antioxidant compounds using HPLC-DAD and LC-MS/MS. Skin-whitening efficacy was evaluated using tyrosinase inhibition and melanin synthesis assays in B16F10 melanoma cells. The 3:1 co-extract of R. coreanus and L. chinense exhibited the highest synergistic increase in total polyphenols and ellagic acid. Furthermore, this specific combination demonstrated maximum tyrosinase inhibition (100%) and significantly reduced cellular melanin synthesis (71.1%) without inducing cytotoxicity.
The 3:1 mixture of R. coreanus and L. chinense was the most effective combination, demonstrating the strongest synergistic effect on both antioxidant and skin-whitening activities.
Keywords:
Rubus coreanus, Lycium chinense, Epimedium koreanum, Antioxidant, Synergistic Effect서 언
현대 피부 미용 과학에서는 활성산소종 (Reactive Oxygen Species, ROS)에 의한 산화적 스트레스가 피부 노화와 색소 침착을 유발하는 핵심 기전으로 작용함에 따라, 천연물 유래 항산화 소재를 활용한 기능성 소재 개발이 활발히 진행되고 있다 (Park and Kim, 2025; Ko et al., 2025; Kim et al., 2026). 활성산소종은 세포 내 산화적 스트레스를 증대시키고 지질 과산화를 촉진함으로써 다양한 피부 질환을 유발하는 주된 요인으로 작용한다 (Hong 2009; Li et al., 2025). 따라서 우수한 항산화 활성을 지닌 천연물은 피부 보호 및 미백 효능을 매개하는 유효성분으로 널리 응용되고 있다. 나아가 피부 내 멜라닌 합성과정은 티로시나아제 (tyrosinase) 효소의 활성화에서 비롯되는 산화적 연쇄반응의 일환이다. 이러한 생화학적 기전을 고려할 때, 천연 항산화제는 산화적 스트레스를 효과적으로 경감시킴으로써 티로시나아제의 발현 및 활성을 억제하고, 결과적으로 멜라닌 생성을 조절하는 데 핵심적인 역할을 수행하는 것으로 평가된다 (Han and Jeong, 2003).
복분자 (Rubus coreanus Miq.)는 장미과에 속하는 낙엽 관목의 열매로, 국내에서는 고창, 정읍, 순창 등지에서 주로 재배되고, 활력 증진, 시력 보호, 신장 기능 강화, 탈모 방지 등의 효능을 지닌 약용 작물로 널리 활용되어 왔다 (Lee et al., 2003). 복분자에 함유된 주요 활성 성분으로는 anthocyanin을 비롯하여 ellagic acid, gallic acid 등의 페놀성 화합물이 대표적이다 (Kim et al., 2012; Chae et al., 2014; Kim et al., 2014; Kim et al., 2016). 이들 성분은 분자 구조 내에 다수의 하이드록시기 (-OH)를 함유하고 있어 우수한 수소 공여 능력을 바탕으로 뛰어난 항산화, 항염증 능력을 보인다 (Papadopoulos and Boskou, 1991; Cha and Cho, 1997; Cha and Cho, 1999). 특히 citric acid와 malic acid 등의 유기산 성분은 복합 추출 시 열역학적 안정성을 유도해 타 성분의 산화적 파괴를 차단하는 보호막 역할을 한다 (Choi et al., 2011).
구기자 (Lycium chinense Mill.)는 가지과에 속하는 낙엽 관목의 열매로, 한반도에서는 전 지역에 자라며 심어 기르는 곳이 많다 (Chae et al., 2023). 구기자는 예로부터 허약 체질 개선, 간과 신장 건강에 도움을 주는 것으로 알려져 있다 (Jeong and Shin, 1990). 구기자에 함유된 주요 성분으로는 betaine, zeaxanthin, beta-carotene, polysaccharides 등이 있으며, 이처럼 풍부한 항산화 성분을 함유해 체내 활성산소를 억제하는 것으로 알려져 있다 (Park et al., 2002; Amagase and Farnswarth, 2011; Masci et al., 2018). 구기자의 다당체 성분들은 수용액 상에서 거대 분자 간의 수소 결합을 형성하여 점성이 생기게 하고, 천연 계면활성 물질로서 작용하기도 한다 (Arumugam et al., 2021). 또한 betaine은 질소 원자에 3개의 메틸기가 결합된 양쪽성 이온으로, 세포막을 외부 유해 자극으로부터 보호하고 삼투압을 조절하여 보습력을 향상시킨다.
삼지구엽초 (Epimedium koreanum Nakai)는 매자나무과에 속하는 다년생 초본 식물로 우리나라 중부 지역에 자생한다. 예로부터 음양곽 (淫羊藿)이라 불리며 한방에서는 활력 증진, 항암, 항바이러스, 이뇨 등에 효능이 있다고 알려져 있다 (Shin et al., 1996; Han et al., 2000). 삼지구엽초의 주요 성분은 icariin과 epimedin A, B, C (Xu et al., 1987; Kang et al., 1991; Li et al., 1998) 등 prenyl–flavonoid 계열이 주성분이다. 이 중 지표 성분인 icariin은 자외선에 의한 피부 손상을 억제하고 피부 탄력을 개선하는 항산화 능력을 가지고 있다 (Mi et al., 2018; Zhi et al., 2026). 그러나 이들은 분자 구조 내에 존재하는 prenyl기 (C5H9)가 탄소와 수소로만 이루어진 사슬구조로 인해 물 분자와 상호작용할 수 없어 수용액에 잘 녹지 않기 때문에 물이나 저농도 에탄올 등의 용매에서는 용해도와 추출 효율이 현저히 떨어진다 (Ding et al., 2023; Mohammadzadeh et al., 2024).
인간은 호흡을 통해 얻은 산소를 활용하여 세포 내 미토콘드리아에서 에너지를 생성하는 대사 과정을 거치며, 이 과정에서 불가피하게 활성산소종이 부산물로 생성된다. 또한 자외선 조사, 만성 스트레스, 미세먼지 등 유해한 환경 요인 역시 피부 조직 내에서 활성산소종을 축적시킨다. 과량의 활성산소종은 생체막의 고도불포화지방산을 공격하여 지질 과산화 반응을 일으키고, 정상적인 피부 세포를 파괴하며 염증성 생체 인자의 발현을 촉진한다 (Li et al., 2025). 더 나아가 멜라닌 형성 세포를 자극해 기미, 주근깨와 같은 과색소 침착을 유발한다 (Hong, 2009).
따라서 본 연구는 항산화 및 피부 미백에 효과가 있는 것으로 알려진 복분자, 삼지구엽초, 구기자의 단일 및 복합 추출물 간의 성분 변화를 비교하고, 이를 통해 각 복합 추출물이 피부 항산화 및 미백에 미치는 시너지 효과를 구명하고자 수행하였다.
재료 및 방법
1. 실험재료
본 실험에 사용된 복분자 (R. coreanus) 열매는 전라북도 고창군에서 재배된 것으로, 6월에 수확해 건조된 미숙과를 사용하였다. 구기자 (L. chinense) 열매는 충남 청양군에서 재배된 것으로, 10월에 수확해 건조된 성숙과를 사용하였다. 삼지구엽초 (E. koreanum) 잎은 강원도 홍천 지역에서 재배된 것으로, 8월에 채취된 잎을 건조하여 사용하였다.
2. 추출조합 및 방법
단일 추출물은 건조 분쇄한 복분자, 구기자, 삼지구엽초 분말 10 g과 시료 중량 10배의 70% EtOH를 이용해 3시간씩 3회 환류추출 하였다 (Martin et al., 2014). 복합 추출물은 총 중량이 10 g이 되도록 Table 1의 비율에 따라 배합하였다. 이러한 혼합 비율은 성분 간의 단순 상호작용을 관찰하기 위한 동일 비율 조건 (1:1, 1:1:1)과 특정 성분의 함량 증대에 따른 활성 증진을 검정하기 위한 가중 비율 조건 (1:3, 1:1:3)으로 설정하였다. 배합된 시료는 단일 추출물과 동일한 조건으로 환류 추출하였다. 추출물은 여과지로 여과 후 회전감압농축기 (N-1300, Eyela, Tokyo, Japan)를 이용하여 농축하였다. 이후 동결건조하여 분석에 이용하였다.

Composition and ratios of the co-extracts.
3. 항산화 활성 측정
총 폴리페놀 함량 측정은 Cho 등 (2008)의 방법을 변형하여 실험하였다. 1000 μg/ml 농도로 희석한 시료 35 μl와 95% EtOH 35 μl, 증류수 175 μl, 1 N Folin-Ciocalteu reagent 35 μl를 모두 혼합해 잘 섞어주고, 5분간 방치한 후 10% Na2CO3 35 μl를 넣어 1시간 이내에 725 nm의 파장에서 분광광도계 (EZ Read 2000, Biochrom, Cambridge, UK)로 흡광도를 측정하였다. 정량은 gallic acid (Sigma-Aldrich, St. Louis, MO, USA)로 작성한 표준곡선을 이용하여 정량하였다.
폴리페놀 함량을 포함한 모든 이론적 기댓값 (theoretical values)은 작물별 단일 추출물의 함량을 기반으로 해당 배합 비율에 따른 함량을 산술적으로 계산하였고, 실험값 (experimental values)은 실제 실험을 통해 분석된 값을 이용하였다.
총 플라보노이드 함량 측정은 Kim과 Lee (2017)의 방법을 변형하여 실험하였다. 1000 μg/ml 농도로 희석한 시료 25 μl와 95% EtOH 75 μl, distilled water 140 μl, 10% aluminium chloride 5 μl, 10% 1 M NaOH 50 μl를 혼합해 상온에서 30분간 반응시킨 후 415 nm의 파장에서 분광광도계 (EZ Read 2000, Biochrom, Cambridge, UK)로 흡광도를 측정하였다. 정량은 naringenin (Sigma-Aldrich, St. Louis, MO, USA)으로 작성한 표준곡선을 이용하여 정량하였다.
4. HPLC-DAD 분석
HPLC-DAD (Agilent 1100, Agilent Technologies, CA, USA) 분석에는 동결 건조 시료를 100배 희석한 후, Sep-Pak 카트리지를 이용해 정제하고 membrane filter (0.22 μm)로 여과하여 분석에 사용하였다. 각 성분별 분석조건은 다음과 같다.
분석용 column은 ZORBAX Eclipse XDB C-18 (4.6 × 150 mm, 5 μm, Agilent Technologies, CA, USA)을 사용하였으며, column 온도는 25℃로 설정하였다. Injection volume은 2 μl, 검출 파장은 254 nm로 설정하였고, flow rate 1.0 ml/min, 이동상은 A (Acetonitrile 100%) 50%, B (water + 0.1% formic acid) 50% 비율로 총 40분간 분석을 수행하였다. 정량은 ellagic acid hydrate (Alfa Aesar, Ward Hill, MA, USA)로 작성한 표준곡선을 이용하여 정량하였다.
분석용 column은 YMC-Pack Pro C18 RS column (150 × 2.0 mm × I.D., 5 μm, YMC Korea Co., Ltd., Seongnam, Korea)을 사용하였고, column 온도는 30℃로 설정하였다. Injection volume은 10 μl로 하였으며, 검출 파장은 271 nm에서 flow rate 0.4 ml/min, 이동상은 A (Acetonitrile 100%) 10%, B (water + 0.1% formic acid) 90% 비율로 총 40분간 분석을 수행하였다. 정량은 gallic acid (Alfa Aesar, Ward Hill, MA, USA)로 작성한 표준곡선을 이용하여 정량하였다.
분석용 column은 YMC-Pack Pro C18 RS column (150 × 2.0 mm × I.D., 5 μm, YMC Korea Co., Ltd., Seongnam, Korea)을 사용하였고, column 온도는 35℃로 설정하였다. Injection volume은 10 μl로 하였으며, 260 nm 파장에서 검출하였다. 기타 분석조건은 Table 2에 나타내었다. 정량은 epimedin C (Alfa Aesar, Ward Hill, MA, USA)와 icariin (Sigma-Aldrich, St. Louis, MO, USA)으로 작성한 표준곡선을 이용하여 정량하였다.
HPLC conditions for analysis of epimedin C and icariin.
5. LC-MS/MS 분석
LC-MS/MS (Agilent 1100, Agilent Technologies, CA, USA) 분석에는 동결 건조 시료를 10배 희석한 후, n-hexane, EtOAc 및 n-BuOH 순으로 분획하고, 각 분획물을 농축·희석하여 분석에 이용하였다. 성분의 함량은 각 분획의 함량을 합산하여 총 함량으로 나타내었다. Mass spectrometer는 positive ion과 selected ion monitoring (SIM) 하에서 분석하였다. Electrospray ionization (ESI)는 4.5 ㎸ spray voltage, capillary voltage는 40 V, tube lens offset은 130 V, capillary temperature은 350℃, sheath gas와 auxiliary gas로 사용된 nitrogen은 각각 35, 5 arbitrary units로 하였다. Betaine (Sigma-Aldrich, St. Louis, MO, USA)은 Xbridge BEH Amide (4.6 × 150 mm × I.D., 3.5 μm, Waters, Milford, MA, USA) column을 이용하였고, acetonitrile과 water (0.1% formic acid, pH 3)을 80 : 20으로 등용매 조건에서 flow rate 0.5 ml/min, column 온도는 25℃, injection volume은 1 μl로 하여 분석하였다. Kaempferol (Sigma-Aldrich, St. Louis, MO, USA), Quercetin (Sigma-Aldrich, St. Louis, MO, USA), quercitrin (Sigma-Aldrich, St. Louis, MO, USA), quercetin-3-O-glucoside (Q-3-O), rutin (Sigma-Aldrich, St. Louis, MO, USA) 성분의 동시 분석에는 YMC-Pack Pro C18 RS column (150 × 2.0 mm× I.D., 5 μm, YMC Korea Co., Ltd., Seongnam, Korea)을 사용하였다. 분석 시 column 온도는 40℃로 유지하였으며, injection volume은 20 μl로 하였다. 기타 분석조건은 Table 3과 4에 나타내었다. 각 성분의 정량은 표준시약을 이용해 작성한 표준곡선을 활용하였으며, quercetin-3-O-glucoside (Q-3-O)는 quercetin을 표준물질로 하여 정량하였다.
Analysis conditions for co-extracts using LC-MS/MS in the positive ionization mode.
LC-MS/MS conditions for analysis of kaempferol, quercetin, quercitrin, and quercetin-3-O-glucoside.
6. 미백효과 분석
B16F10 melanoma cell은 ATCC (American Type Culture Collection, USA)에서 분양받아 사용하였다. 세포 배양을 위한 배지는 10% fetal bovine serum (FBS, Welgene, Gyeongsan, Korea)과 1× P/S (Penicillin-Streptomycin)이 포함된 Dulbecco’s Modified Eagle Medium (DMEM, Thermo Fisher Scientific Inc.)를 사용하였고, 배양은 37℃, 5% CO2 incubator (ARA Plus Series CO2 Incubator, APA 170SV-R, BMS, Seoul, Korea)에서 배양하였다.
세포 독성 측정 방법은 Park 등 (2024)의 방법을 변형하여 실험하였다. 배양된 B16F10 melanoma cell을 96-well plate에 5 × 10³ cells/well의 농도로 분주해 24시간 동안 안정화시킨 후 각각의 추출물을 농도별로 처리하여 48시간 배양하였다. PBS (Phosphate-Buffered Saline)에 5 mg/ml의 농도로 희석해 제조한 MTT 용액을 각 well에 10 μl씩 가하고, 37℃, 5% CO2 조건에서 4시간 동안 반응시켰다. 이후 각 well에 있는 용액을 모두 제거한 뒤, 100 μl dimethyl sulfoxide (DMSO, Sigma-Aldrich Co. St Louis, USA)를 처리하여 formazan 결정을 용해시켰다. 용액은 microplate reader (EZ Read 2000, Biochrom, Cambridge, England)를 이용하여 540 nm에서 흡광도를 측정하였다. 세포 생존율은 무처리군의 평균 흡광도 값을 기준으로 추출물 처리군의 평균 흡광도 값에 대한 백분율로 계산하였다.
Tyrosinase 저해 활성은 Tomita 등 (1990)의 방법을 변형하여 측정하였다. 0.1 M sodium phosphate buffer (pH 6.5) 3.2 ml, 1000 mg/ml 농도의 시료 100 μl, mushroom tyrosinase (1100 U/ml) (Sigma-Aldrich, St. Louis, MO, USA) 50 μl와 1.5 mM L-tyrosine (Sigma-Aldrich, St. Louis, MO, USA)를 모두 섞어 37℃에서 15분간 반응시킨 다음 475 nm에서 흡광도를 측정하였다. 대조군은 시료 대신 0.1 M sodium posphate buffer (pH 6.5)를 사용하였고, 양성대조군으로는 1000 mg/ml 농도의 ascorbic acid를 사용하였다. Tyrosinase 활성 저해율 (%)은 다음 공식에 의해 구하였다.
A : 시료가 없는 대조군의 475 nm에서 흡광도
B : 시료와 효소가 없는대조군의 475 nm에서 흡광도
C : 시료와 효소를 넣은실험군의 475 nm에서 흡광도
D : 효소가 없는 대조군의 475 nm에서 흡광도
추출물의 세포 내 멜라닌 생성 억제 효과를 분석하기 위해, Hosoi 등 (1985)의 방법을 일부 변형하여 멜라닌 함량을 측정하였다. 배양된 B16F10 melanoma cell을 6-well plate에 1 × 10⁵ cells/well의 농도로 분주해 24시간 동안 안정화시킨 후 각각의 추출물을 농도별로 처리하고, 동시에 α-MSH (Sigma-Aldrich, St. Louis, MO, USA)를 500 nM 농도로 처리하여 72시간 배양하였다. 이후 1 N NaOH 용액 200 μl를 첨가하여 80℃에서 1시간 동안 세포를 용해하고 405 nm에서 흡광도를 측정한 뒤, 추출물 처리군의 평균 흡광도 값을 control인 무처리군에 대비해 억제 효과로 나타내었다.
7. 통계 분석
모든 실험은 3회 반복으로 수행되었으며, 실험데이터는 SPSS (SPSS version 21.0, SPSS Inc., Chicago, IL, USA) 프로그램을 이용하여 각 데이터는 일원배치 분산분석 (one-way ANOVA)을 실시한 뒤, Student’s t-test 또는 Duncan’s Multiple Range Test (DMRT)을 통해 0.1%, 1.0%, 5% 수준에서 통계학적 유의성을 검정하였다. 주성분 분석과 회귀 분석은 R program (RStudio Server Pro 4.2.2)을 이용하였다.
결과 및 고찰
1. 항산화 시너지 효과 및 최적 배합 비율 도출
복분자, 구기자, 삼지구엽초 단일 추출물과 이들을 배합한 복합 추출물의 항산화 효능을 비교하기 위해 폴리페놀, 플라보노이드 함량을 분석하였다. 그 결과, 폴리페놀 함량은 단일 추출물의 경우 복분자는 291.8 mg/g, 구기자는 12.0 mg/g, 삼지구엽초는 30.0 mg/g으로 복분자에서 가장 높은 함량을 보였다 (Table 5). 복합 추출물은 작물별 단일 추출물의 페놀 함량을 기반으로, 해당 배합 비율에 따른 함량을 산술적으로 계산하여 도출한 이론적 기댓값 (theoretical values)과 실제 실험값 (experimental values)을 비교해 시너지 효과를 판단하였다. 복분자 (R. coreanus)와 구기자 (L. chinense)가 혼합된 RL (1:1), RL (1:3), RL (3:1) 조합에서는 각각 305.6, 381.4, 952.7 mg/g으로, 이론적 기댓값 대비 0.7, 16.2, 7.4%씩 상승하였다. 복분자와 삼지구엽초 (E. koreanum)가 혼합된 RE (1:1), RE (1:3), RE (3:1) 조합에서는 각각 472.8, 531.2, 1,040.9 mg/g으로 이론적 기댓값 대비 46.9, 39.0, 15%씩 상승하였다. 구기자와 삼지구엽초가 혼합된 LE (1:1), LE (1:3), LE (3:1) 조합에서도 각각 37.4, 138.4, 61.4 mg/g으로 이론적 기댓값 대비 -11.0, 35.3, -7.6%의 증감을 나타냈다. 복분자, 구기자, 삼지구엽초가 모두 혼합된 RLE (1:1:1), RLE (1:1:3), RLE (1:3:1), RLE (3:1:1) 조합에서는 각각 388.4, 524.2, 293.5, 1,031.9 mg/g으로 16.2, 33.1, -18.2, 12.5%씩의 증감을 나타냈다. 분석 결과, 복분자 없이 구기자와 삼지구엽초가 동일 비율로 혼합되거나 구기자의 비율이 높은 LE (1:1), LE (3:1), RLE (1:3:1)의 조합의 경우, 실험값이 이론적 기댓값보다 각각 -11.9, -7.6, -18.2%로 낮게 나타났다. 반면, 복분자가 포함되면서 그 배합 비율이 높은 RE (1:1), RE (3:1), RL (3:1), RLE (3:1:1) 조합에서는 단일 추출물 대비 폴리페놀 함량이 높아지는 것을 확인할 수 있었다. 이것은 구기자나 삼지구엽초의 특정 대사산물들이 복분자 페놀 화합물의 용해도를 돕는 보조 용매 역할로 작용하여 추출 수율이 높아진 것으로 보인다 (Wang et al., 2011).
Comparison of theoretical and experimental total polyphenol and total flavonoid contents in single and co-extracts.
플라보노이드 함량은 단일 추출물의 경우 복분자는 176.2 mg/g, 구기자는 24.9 mg/g, 삼지구엽초는 114.5 mg/g으로 폴리페놀 함량과 유사하게 복분자에서 가장 높은 함량을 보였다 (Table 5). 복합 추출물에서 복분자와 구기자가 혼합된 RL (1:1), RL (1:3), RL (3:1) 조합에서는 각각 169.0, 159.2, 601.3 mg/g으로 기댓값에 비해 -15.9, -36.7, 8.7%만큼 증감하였다. 복분자와 삼지구엽초가 혼합된 RE (1:1), RE (1:3), RE (3:1) 조합에서는 각각 317.3, 599.1, 508.0 mg/g으로 8.9, 15.2, -21.1%만큼 증감하였다. 그리고 구기자와 삼지구엽초가 혼합된 LE (1:1), LE (1:3), LE (3:1)에서는 각각 119.0, 386.3, 253.0 mg/g으로 -14.4, 4.9, 33.9%의 증감을 나타내었다. 복분자, 구기자, 삼지구엽초가 모두 혼합된 RLE (1:1:1), RLE (1:1:3), RLE (1:3:1), RLE (3:1:1) 조합에서도 각각 273.5, 460.8, 379.6, 759.1 mg/g으로 -13.3, -15.4, 4.1, 13.6%의 증감을 나타내었다. 이상의 결과를 종합하면, 복분자에 구기자가 혼합된 RL (1:1), RL (1:3) 조합이나 세 가지 작물이 동일 비율로 혼합된 RLE (1:1:1) 조합에서는 플라보노이드의 함량 증대가 다소 저해되는 양상을 보였다. 반면, 복분자의 혼합 비율이 높은 RLE (3:1:1), RL (3:1) 조합과 삼지구엽초의 혼합 비율이 높은 RE (1:3), LE (3:1) 등의 조합에서는 플라보노이드 함량이 크게 증가하였다. 이것은 폴리페놀 함량의 결과와 유사하게, 최적의 배합 조건에서 복분자와 삼지구엽초의 유기산, 아미노산, 당류들이 상호 작용하여 천연 공융 용매 (Natural Deep Eutectic Solvents, NADES) 역할을 함으로써, 난용성 플라보노이드 화합물의 용해도를 극대화시킨 결과로 판단된다 (Wang et al., 2011).
항산화 성분 함량 분석 (polyphenol and flavonoid content) 결과, RE (1:3), RE (3:1), RL (3:1), RLE (1:1:3), RLE (3:1:1) 조합들이 가장 우수한 성분 함량을 나타내는 최적 배합 비율로 선발되었다 (Table 5).
선발된 복합 추출물의 배합 비율이 폴리페놀 함량에 미치는 영향을 구명하기 위해 회귀 분석 (regression analysis)을 실시하였다. 그 결과 추출물별 단독 (100%) 추출 시 복분자의 폴리페놀 함량이 가장 높았고, 구기자와 삼지구엽초는 복분자에 비해 낮았다. 그리고 복분자는 단독 추출보다는 복분자 75%와 다른 추출물 25% 조합으로 복합 추출 시 단독 추출보다 높은 폴리페놀 함량을 보였고, 복분자의 비율이 감소할수록 폴리페놀 함량도 감소하였다. 그러나 구기자와 삼지구엽초는 단독 (100%)으로 사용되거나 다른 추출물에 비해 높은 비율로 복합 추출할 때보다, 복분자 추출물을 기반으로 하여 이들을 소량 첨가하였을 때 상승 작용이 나타나는 것으로 확인되었다 (Fig. 1). 회귀분석만으로는 3가지 복합 추출물의 배합 비율에 따른 영향을 구명하기 어렵기 때문에 추가로 주성분 분석 (PCA)을 실시하였다 (Fig. 2). 그 결과, PC1과 PC2가 91.2%의 설명력을 가지는 것으로 나타났고, 이 중 PC1이 53.7%의 설명력을 가지는 것으로 나타났다. 즉, 구기자 (L)와 삼지구엽초 (E)의 혼합 비율은 3 (75%)으로 높더라도 음의 방향이나 중간 위치에 위치한 반면 복분자 (R)의 혼합 비율이 3 (75%)일 경우 다른 성분의 비율에 관계없이 양의 방향에 위치해 있어 폴리페놀 함량 증대에 가장 큰 영향을 미치는 주요 요인 (PC1)은 ‘복분자의 배합 비율’인 것으로 나타났다.
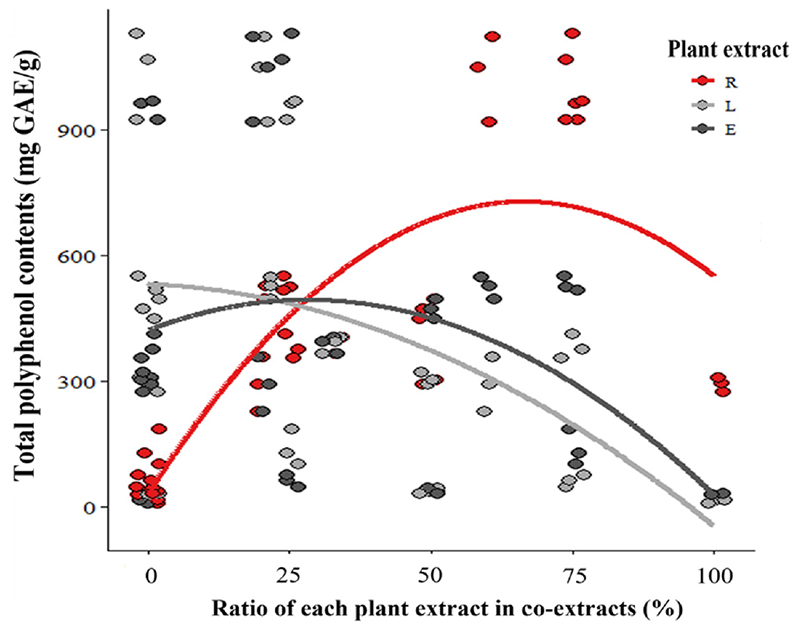
Quadratic regression models between the total polyphenol contents and the blending ratio of each plant extract in the co-extracts. The scatter plot with fitted trend lines illustrates the changes in total polyphenol content as the proportion. The ratio represents the proportion of each extract in the total mixture, ranging from 0 to 100, where 100 indicates a single extract and 0 indicates the absence of the respective extract in the combination. R; R. coreanus (red), L; L. chinense (gray), E; E. koreanum (black).
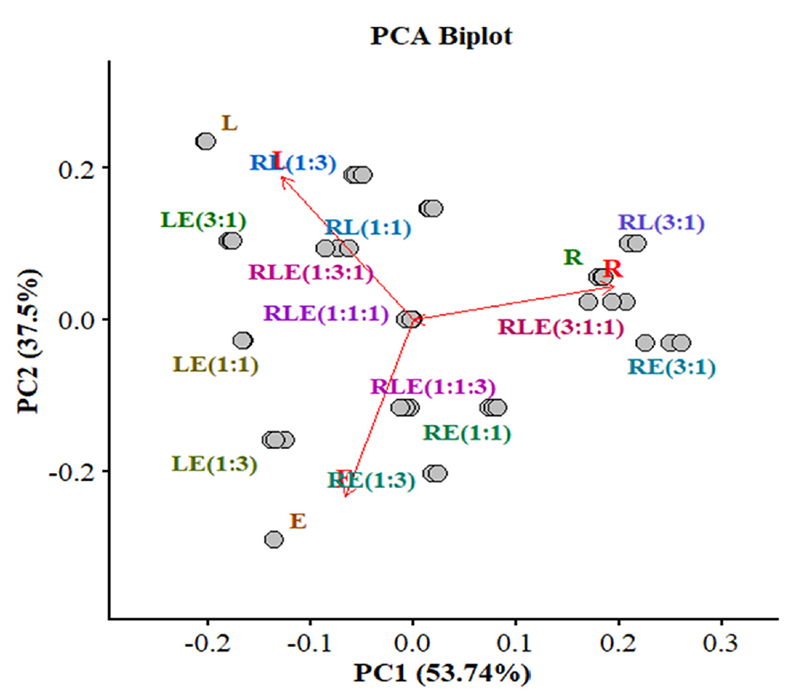
Principal component analysis of the co-extracts based on polyphenol contents. The vectors represent the influence of each component on the principal components (PC 1 and PC 2). The points indicate the clustering patterns of various formulation ratios. R (R. coreanus), L (L. chinense), and E (E. koreanum) denote single extracts, and ratios in parentheses indicate the proportions of the co-extracts (e.g., RL, RLE).
2. 지표성분 분석
주요 성분별 시너지 효과를 구명하기 위해 HPLC-DAD 및 LC-MS/MS를 이용해 단일 추출물과 선정된 5가지 복합 추출물의 주요 지표 성분과 공통 성분의 정량적 함량 변화를 분석하였다.
Ellagic acid의 분석 결과, 복분자는 1.43 mg/g, 구기자는 0.50 mg/g, 삼지구엽초는 0.57 mg/g으로 단일 추출물에서 복분자가 가장 높은 함량을 보였다 (Fig. 3A). 이론적 기댓값과 실제 실험값을 비교해 시너지 효과를 분석해 보면, RE (1:3), RE (3:1), RL (3:1), RLE (1:1:3), RLE (3:1:1) 조합의 ellagic acid는 각각 7.14, 2.20, 9.61, 4.12, 7.79 mg/g으로 이론적 기댓값인 3.14, 1.62, 1.60, 3.64, 1.79 mg/g에 비해 각각 2.3배, 1.4배, 6.0배, 1.1배, 4.4배 증가한 값을 나타냈다. 이것은 복합 추출 공정 중 가해지는 열역학적 반응 조건하에서 단량체 형태인 gallic acid 분자들이 탄소-탄소 산화적 결합을 통해 ellagic acid로 이합체화 (dimerization) 되었기 때문으로 판단된다 (Fig. 4). Kurin 등 (2025)은 여러 식물 소재가 혼합된 추출물에서는 페놀성 화합물 간의 산화-환원 반응이 발생하여 특정 페놀성 화합물의 함량이 증가한다고 하였는데, 본 연구의 ellagic acid 합성 기전에서도 동일한 경향이 확인되었다. 특히 이 과정에서 구기자와 삼지구엽초에 함유된 flavonoid 배당체나 epimedin C들이 촉매로 작용하여 결합을 유도하였고, 복분자 내 거대 분자인 ellagitannin의 가수분해 현상 역시 ellagic acid 생성에 기여했을 것으로 판단된다 (Quideau et al., 2011). 이러한 ellagic acid의 시너지 기작은 gallic acid의 함량 감소를 통해서도 증명되었다. Gallic acid의 함량을 분석한 결과, 단일 추출물인 복분자, 구기자, 삼지구엽초에서는 각각 1.69, 1.71, 0.93 mg/g으로 나타났다 (Fig. 3B). 그리고 복합 추출물 중 RLE (3:1:1)과 RL (3:1) 조합의 gallic acid 함량은 각각 2.48, 4.62 mg/g으로 측정되어, 이론적 기댓값 (각각 2.06, 2.26 mg/g) 대비 약 1.2배, 2.0배 증가하였다. 반면, RE (1:3), RE (3:1), RLE (1:1:3) 조합의 함량은 각각 3.54, 0.46, 2.09 mg/g으로 측정되어, 이론적 기댓값 (각각 4.48, 2.00, 6.19 mg/g) 대비 약 0.8배, 0.2배, 0.3배 수준으로 감소하였다. 특히 RE (3:1) 조합과 같이 삼지구엽초가 함유된 특정 복합 추출물 군에서는 gallic acid의 검출량이 급격히 감소하는 경향이 나타났다. 이것은 전위 차이를 가진 페놀 화합물들은 서로 전자를 주고받는 재생 사이클을 형성하거나, 특정 성분이 산화되어 타 화합물의 합성을 돕는 현상이 발생한다 (Jovanovic et al., 1996; Jørgensen et al., 1999). 따라서 gallic acid가 단순히 파괴되거나 소실된 것이 아니라, ellagic acid 합성을 위한 전구체로 소모되었기 때문으로 판단된다 (Fig. 4). 즉, gallic acid는 당전이효소 촉매하에 β-glucogallin을 거쳐 ellagic acid로 전환되므로, 그 함량 감소는 생합성 경로의 활성화를 시사한다 (Schulenburg et al., 2016). 실제로 식물 추출물에서의 gallic acid 감소가 ellagic acid 증가에 기여한다는 사실이 많은 논문들에서 보고된 바 있다 (Freeman et al., 2010; Ohkatsu and Suzuki, 2011; Sharifi-Rad et al., 2022).
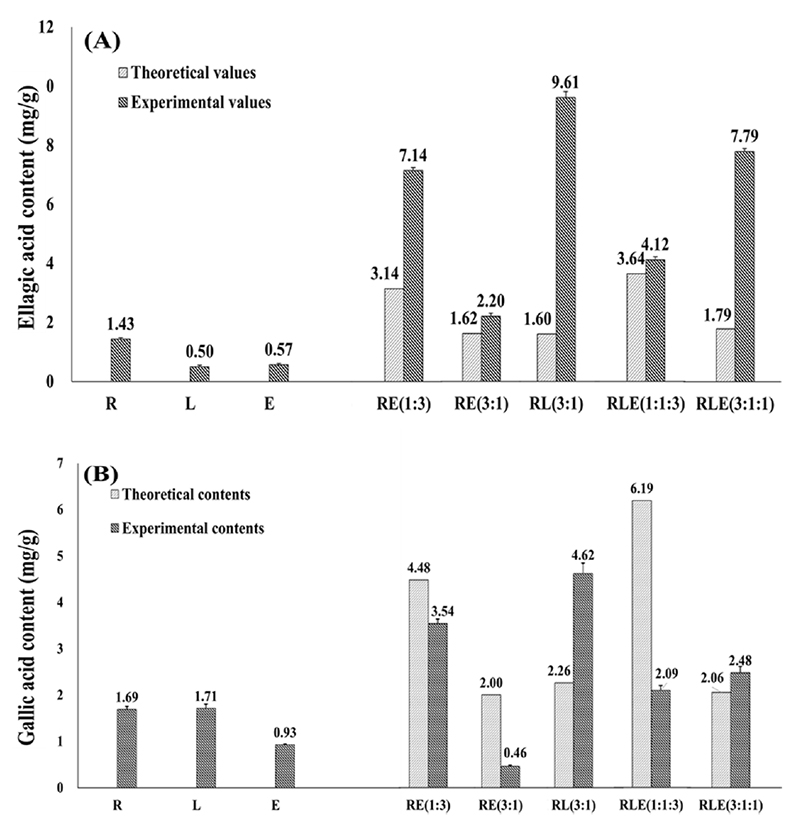
Contents of ellagic acid (A) and gallic acid (B) in single and co-extracts determined by HPLC-DAD. R (R. coreanus), L (L. chinense), and E (E. koreanum) denote single extracts, and ratios in parentheses indicate the proportions of the co-extracts (e.g., RE, RLE).
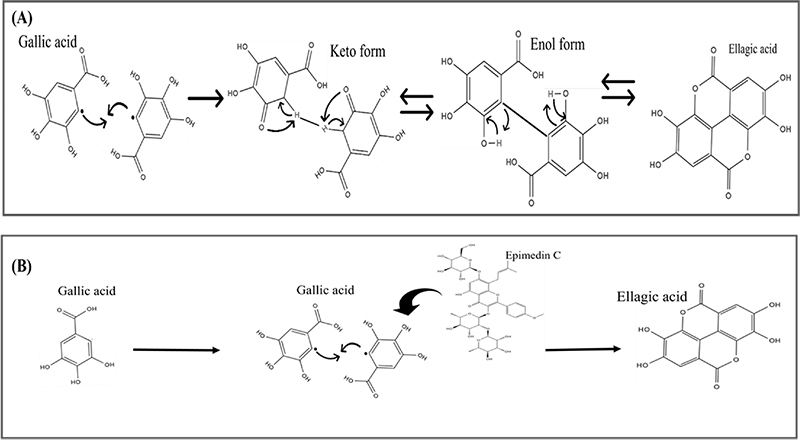
Mechanism for ellagic acid formation from gallic acid. (A); The pathway involves the oxidative coupling of gallic acid radicals followed by keto-enol tautomerism and subsequent lactonization to yield ellagic acid (Kurin et al., 2025). and (B); flavonoids-mediated redox reactions promotes the conversion of gallic acid to ellagic acid (Sharifi-Rad et al., 2022; Schulenburg et al., 2016).
삼지구엽초의 지표 성분인 epimedin C와 icariin의 함량은 단일 추출물에서 각각 0.75, 0.31 mg/g으로 나타났다 (Fig. 5). 한편, 복분자와 구기자로만 구성된 RL (3:1) 조합의 경우 지표 성분의 원물인 삼지구엽초가 배합되지 않았으므로 두 성분 모두 검출되지 않았다 (Fig. 5A). 삼지구엽초가 포함된 복합 추출물 중 RE (3:1), RLE (1:1:3), RLE (3:1:1) 조합의 epimedin C 함량은 각각 0.72, 16.82, 2.24 mg/g으로, 이론적 기댓값인 0.25, 2.24, 0.25 mg/g 대비 약 2.9배, 7.5배, 9.0배로 크게 증가하였다. 반면, RE (1:3) 조합은 1.33 mg/g으로 이론적 기댓값인 2.24 mg/g 대비 약 0.6배 수준으로 감소하였다. Icariin의 경우, 삼지구엽초가 포함된 모든 조합 [RE (1:3), RE (3:1), RLE (3:1:1), RLE (1:1:3)]에서 각각 0.30, 0.20, 2.33, 2.58 mg/g을 함유하고 있어, 이론적 수치인 0.23, 0.08, 0.06, 0.19 mg/g 대비 약 1.3배, 2.5배, 38.8배, 13.6배로 모두 유의미하게 증가하는 양상을 보였다 (Fig. 5B). 이것은 분자 구조 내 소수성 prenyl기를 가져 용출이 어려운 epimedin C와 icariin이 복분자의 천연 유기산과 구기자의 아미노산 및 당류 성분들과 결합해 NADES를 형성했기 때문으로 판단된다. 실제 전통 생약재를 복합 추출할 경우 성분 간의 용해도 증가로 난용성 화합물의 추출 수율이 상승하는 시너지 효과가 발생하기도 한다 (Yang et al., 2009; Choi et al., 2011; Wang et al., 2011).
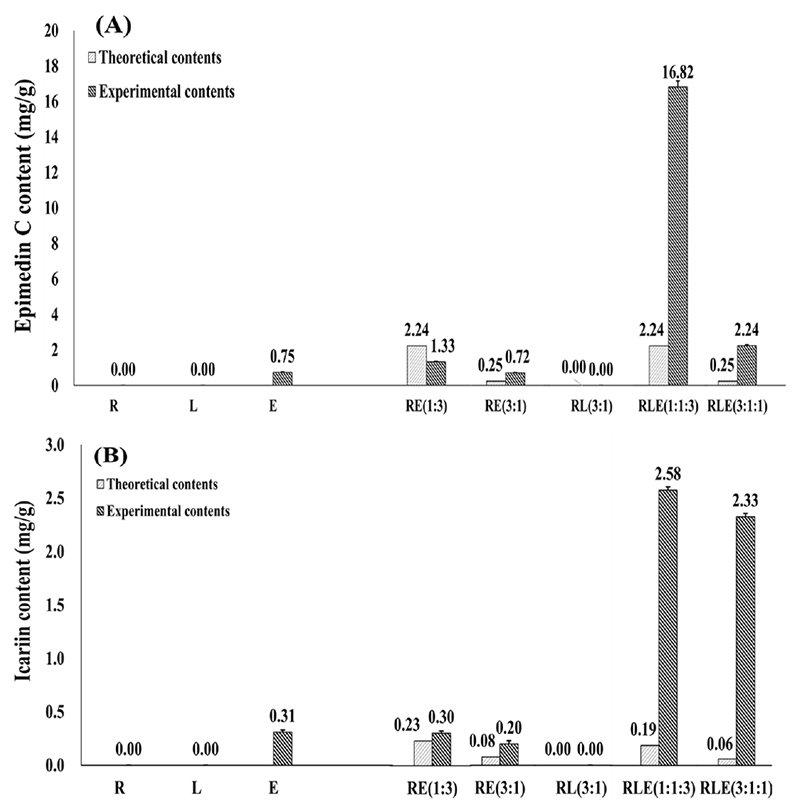
Contents of epimedin C (A) and icariin (B) in single and co-extracts determined by HPLC-DAD. R (R. coreanus), L (L. chinense), and E (E. koreanum) denote single extracts, and ratios in parentheses indicate the proportions of the co-extracts (e.g., RE, RLE).
구기자의 지표 성분인 betaine 함량은 단일 추출물의 경우 복분자, 구기자, 삼지구엽초에서 각각 0.02, 2.57, 0.02 mg/g으로 나타났다 (Fig. 6). 복합 추출물 중 RE (1:3), RE (3:1), RL (3:1), RLE (3:1:1) 조합의 betaine 함량은 각각 0.17, 0.03, 4.48, 2.81 mg/g으로 이론적 기댓값인 0.08, 0.02, 0.87, 0.88 mg/g 대비 약 2.1배, 1.5배, 5.1배, 3.2배로 크게 증가하였다. 반면, 삼지구엽초의 비율이 높은 RLE (1:1:3) 조합에서는 1.23 mg/g으로 이론적 기댓값인 2.65 mg/g 대비 약 0.5배 감소하였다. 이처럼 특정 조합에서 betaine의 추출 수율이 오히려 감소한 것은, 식물 소재 간의 혼합 비율이 최적의 NADES 형성 조건을 충족하지 못하여 용매의 물리화학적 구조가 붕괴되었기 때문으로 판단된다. Dai 등 (2013)은 NADES가 특정 몰비에서만 안정한 수소 결합 네트워크를 형성하며, 이 범위 를 벗어날 경우 가용화 능력이 급격히 저하됨을 보고하였다. 이러한 선행연구 결과에 미루어 볼 때, RLE (1:1:3) 조합에서는 과량 혼합된 삼지구엽초 성분이 입체 장애와 경쟁적 상호작용을 유발하여 betaine 용해에 필요한 수소 결합을 저해한 것으로 추정된다. 반면, betaine 함량이 유의미하게 증가한 나머지 조합들은 앞서 언급한 바와 같이 복합 추출 중 구기자의 betaine 성분이 복분자의 유기산과 결합해 최적의 NADES 환경을 조성하고, 이에 따른 자체적인 용해성 증가와 열역학적 안정화 효과를 유발했기 때문으로 판단된다. 특히 Teslić 등(2022)은 betaine 기반의 NADES 환경이 ellagitannin의 가수분해를 촉진하고 ellagic acid와 같은 페놀성 물질의 용해도를 극대화하는 데 탁월한 효과가 있다고 보고하였다. 실제 본 연구에서도 RL (3:1) 혼합 조건에서 betaine 함량이 이론적 기댓값인 0.87 mg/g에 비해 5배 이상 크게 증가한 4.48 mg/g으로 측정되어, 이러한 NADES 형성 기전을 뒷받침하고 있다.
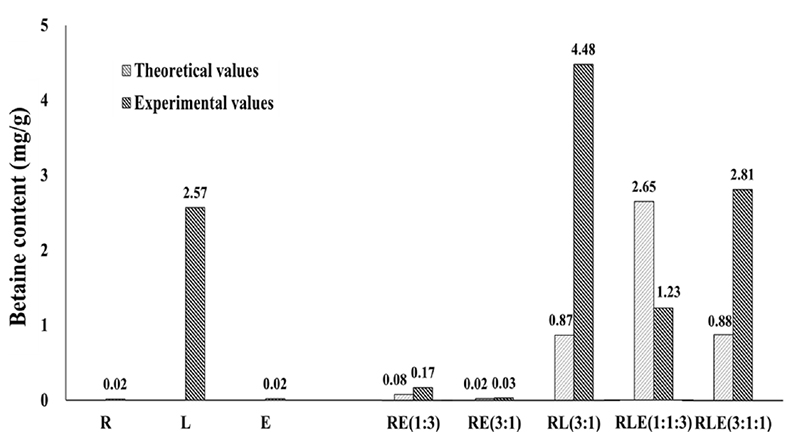
Betaine contents in single and co-extracts determined by LC-MS/MS. R (R. coreanus), L (L. chinense), and E (E. koreanum) denote single extracts, and ratios in parentheses indicate the proportions of the co-extracts (e.g., RE, RLE).
3. Flavonoid계 유효 성분 분석
복합 추출물에 공통으로 함유되어 있는 flavonoid 함량에 대한 시너지 효과를 확인하기 위해 kaempferol, quercetin, quercitrin, quercetin-3-O-glucoside (Q-3-O), rutin 등 공통 flavonoid계 유효 성분을 LC-MS/MS를 통해 분석하였다 (Table 6). 그 결과 단일 추출물의 경우 복분자, 구기자, 삼지구엽초에서 5가지 성분의 전체 함량이 각각 0.83, 1.15, 1.10 mg/g으로 나타났다. 선발된 복합 추출물 RE (1:3), RE (3:1), RL (3:1), RLE (1:1:3), RLE (3:1:1) 조합에서 flavonoid의 전체 함량은 각각 2.34, 0.46, 6.76, 23.22, 3.56 mg/g으로 나타났다. 이것은 이론적 기댓값인 4.11, 1.19, 1.20, 5.28, 1.57 mg/g 대비 0.6배, 0.4배, 5.6배, 4.4배, 2.3배 수준으로 증가하였다. 이러한 flavonoid계 성분의 함량 증가는 다른 성분들 간 상호작용에 의해 용출 효율 증진에 따른 것으로 판단된다. 특히 구기자에 다량 함유된 rutin 등의 flavonoid 배당체 및 다당류 성분들이 복분자에 다량 함유된 ellagitannin의 자가 응집을 막아 단독 추출 시 용출되지 못했던 flavonoid계 유효성분들의 추출 수율을 높였기 때문으로 판단된다. Mamet 등 (2018)은 식물체 내의 flavonoid 배당체와 다당류 구조가 거대 분자인 tannin의 분자간 결합을 차단하여 침전 및 자가 응집을 억제한다고 하였다. 또한 Koleckar 등 (2008)도 유효 성분 간의 공간적 배치 구조가 유효 성분의 용출 안정성을 높인다고 보고하기도 하였다.
Comparison of theoretical and experimental contents of common flavonoids across co-extracts analyzed by LC-MS/MS.
4. 세포실험
앞선 실험에서 구명한 항산화 물질에 대한 시너지 효과를 미백 실험에 적용하기에 앞서, 추출물의 독성에 따른 세포 사멸이 미백 효과로 오인되는 것을 배제하고자 세포 독성 평가를 실시하였다. B16F10 melanoma cell에 복분자, 구기자, 삼지구엽초 단일 추출물 및 복합 추출물을 10, 50, 100, 200, 500 μg/ml의 농도로 처리하여 세포 생존율을 확인하였다 (Fig. 7). 그 결과 복분자, 구기자, 삼지구엽초 추출물과 선발된 5종의 복합 추출물은 500 μg/ml 농도 이하에서 B16F10 melanoma cell에 세포 독성을 나타내지 않음을 확인하였다. 본 연구에서 확인된 세포 안전성은 선행 연구에서도 복분자와 삼지구엽초는 500 μg/ml 농도 수준에서 세포 독성을 유발하지 않는 것으로 확인되었고, 구기자 역시 최대 1,000 μg/ml의 농도까지 세포 독성을 보이지 않는다는 연구 결과와 일치한다 (Lee et al., 2003; Yoo and Kim, 2018; Lee et al., 2022).
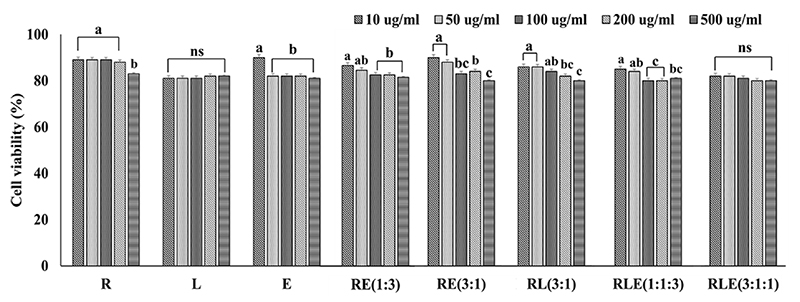
Cell viability of single and co-extracts at various concentrations. Cell viability was determined via MTT assay. R (R. coreanus), L (L. chinense), and E (E. koreanum) denote single extracts, and ratios in parentheses indicate the proportions of the co-extracts (e.g., RE, RLE). Values with the same letter are not significantly different, and values with different letters are significantly different according to Duncan's multiple range test (p < 0.05).
복분자, 구기자, 삼지구엽초 단일 추출물 및 이들의 복합 추출물에 대한 in vitro tyrosinase 저해 활성을 평가하였다 (Fig. 8). 그 결과 양성 대조군인 ascorbic acid가 100%의 저해 활성을 나타낸 가운데, 단일 추출물인 구기자와 삼지구엽초는 각각 44.2%, 28.7%의 저해 활성을 보였으며 복분자는 20.4%로 가장 낮은 활성을 보였다. 반면 복합 추출물 처리에서는 RLE (1:1:3) 조합에서 33.1%로 가장 낮았고, 그 다음으로 RE (3:1) 조합이 62.0%, RLE (3:1:1) 조합이 66.1%, RE (1:3) 조합이 77.7%의 저해 활성을 나타내어 양성 대조군인 ascorbic acid보다 낮은 활성을 나타내었다. 그러나 항산화 활성과 성분 분석에서 뛰어난 시너지 효과를 보였던 RL (3:1) 조합은 100%로 양성 대조군에 버금가는 가장 높은 억제 효과를 나타냈다. 단일 추출물의 경우 억제 효과가 미미하거나 없는 수준이었으나 복합 추출물의 경우 저해 활성이 전반적으로 상승하는 시너지 효과를 보였으며, 특히 RL (3:1) 조합은 tyrosinase 저해 활성이 뛰어남을 확인하였다. 앞선 항산화 실험에서 복분자가 우수한 항산화 활성과 높은 ellagic acid 함량을 보였음에도 불구하고, tyrosinase 억제 실험에서 가장 낮은 활성을 나타낸 것은 ellagic acid가 이미 생성된 tyrosinase의 활성 부위에 직접 결합하여 물리적으로 억제하는 능력이 비교적 낮기 때문으로 판단된다 (Song et al., 2009). 그러나 이를 구기자와 복합 추출한 RL (3:1) 조합의 경우, 앞서 언급한 것처럼 천연 공융용매 (NADES) 환경을 조성함으로써, 단독 추출 시 용출되지 못했던 플라보노이드계 및 타 유효 성분들의 용해도를 극대화하고 성분 간의 융합을 유도하였다. 결과적으로 RL (3:1) 조합의 높은 저해 활성은 이러한 시너지 효과가 tyrosinase 활성 부위에 대한 유효 성분의 결합 능력을 강화했기 때문인 것으로 사료된다 (Koleckar et al., 2008; Choi et al., 2011; Mamet et al., 2018).
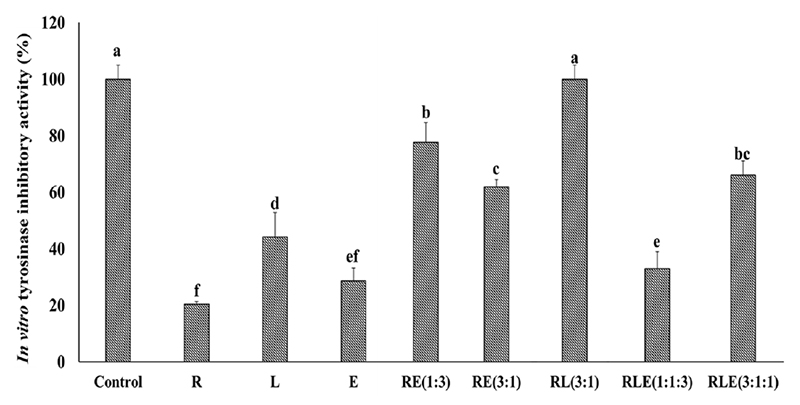
In vitro tyrosinase inhibitory activity of single and co-extracts. Control represents the positive control (ascorbic acid, 1,000 μg/ml), and all extracts were treated at a concentration of 1,000 μg/ml. R (R. coreanus), L (L. chinense), and E (E. koreanum) denote single extracts, and ratios in parentheses indicate the proportions of the co-extracts (e.g., RE, RLE). Values with the same letter are not significantly different, and values with different letters are significantly different according to Duncan's multiple range test (p < 0.05).
세포 독성이 없는 농도 조건에서 α-MSH로 멜라닌 생성을 유도한 B16F10 melanoma cell에 추출물을 처리하여 세포 내 멜라닌 생성 억제 효과를 분석하였다 (Fig. 9). 양성 대조군 (control)으로 사용된 arbutin이 무처리군 (NT) 대비 멜라닌 생성을 약 56.3% 억제하였고, 단일 추출물 처리 시 복분자는 약 46.6%, 구기자는 약 4.7%, 삼지구엽초는 약 38.8%의 멜라닌 생성 억제 효과를 보였다. 복합 추출물 처리군에서는 RE (3:1) 조합이 약 61.7%, RE (1:3) 조합은 약 57.8%, RLE (1:1:3) 조합은 약 47.4%, RLE (3:1:1) 조합이 약 25.5%의 멜라닌 생성 억제 효과를 보였다. 마지막으로 RL (3:1) 조합은 약 71.1% 수준까지 멜라닌 생성을 억제하여 arbutin보다 우수한 멜라닌 생성 억제 효과가 있음을 입증하였다.
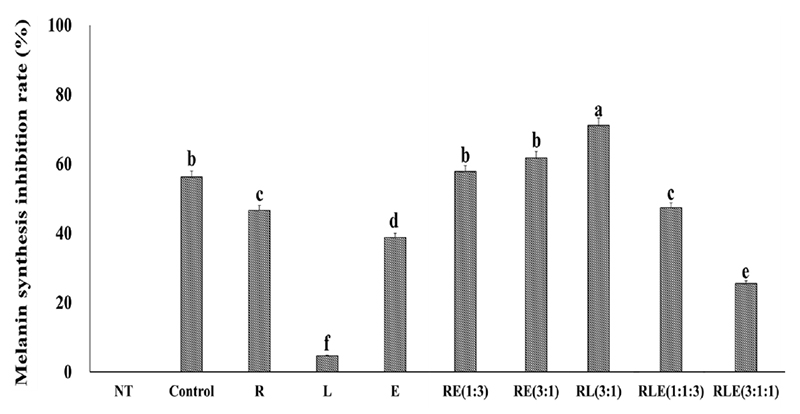
Inhibition of melanin synthesis by single and co-extracts in melanogenesis-induced cells. NT means non-treatment and arbutin was used as a positive control. R (R. coreanus), L (L. chinense), and E (E. koreanum) denote single extracts, and ratios in parentheses indicate the proportions of the co-extracts (e.g., RE, RLE). Values with the same letter are not significantly different, and values with different letters are significantly different according to Duncan's multiple range test (p < 0.05).
복분자 단일 추출물의 경우 in vitro tyrosinase 저해 실험에서는 효과가 전무했던 것과 달리, B16F10 melanoma cell에서는 멜라닌 생성을 약 46.6% 수준으로 억제하여 유의미한 미백 효과를 보였다. 이러한 in vitro tyrosinase 억제 활성과 세포 내 멜라닌 생성 억제 효능의 불일치는 Song 등 (2009)의 연구에서도 보고된 바 있다. 이것은 버섯 유래 tyrosinase를 이용한 효소 활성 저해 결과가 포유류 세포 내에서의 멜라닌 생성 억제 효능과 반드시 비례하지 않기 때문이다. 복분자 복합 추출물 [RL (3:1)]의 우수한 세포 내 미백 효능은 이미 생성된 tyrosinase 효소를 직접 저해하기보다는, 세포 내 신호전달 과정을 조절하여 tyrosinase 및 TRP-1, TRP-2 단백질의 발현 자체를 억제하는 간접적 기전에 기인한 것으로 판단된다 (Oh et al., 2006). 따라서 본 연구 결과의 생물학적 타당성을 검증하기 위해 제브라피쉬 (Zebrafish)를 이용한 in vivo 멜라닌 생성 억제 실험을 추가로 수행할 계획이다.
References
-
Amagase H and Farnsworth NR. (2011). A review of botanical characteristics, phytochemistry, clinical relevance in efficacy and safety of Lycium barbarum fruit(Goji). Food Research International. 44:1702-1717.
[https://doi.org/10.1016/j.foodres.2011.03.027]

-
Martin AC, Pawlus AD, Jewett EM, Wyse DL, Angerhofer CK and Hegeman AD (2014). Evaluating solvent extraction systems using metabolomics approaches. Royal Society of Chemistry. 4:26325-26334.
[https://doi.org/10.1039/C4RA02731K]
-
Arumugam MK, Paal MC, Donohue TM, Ganesan M, Osna NA and Kharbanda KK. (2021). Beneficial effects of betaine: A comprehensive review. Biology. 10:456. https://www.mdpi.com/2079-7737/10/6/456, (cited by 2026 Jun 13).
[https://doi.org/10.3390/biology10060456]
- Cha JY and Cho YS. (1997). Effects of hesperidin, naringin and their aglycones on the in vitro assay phosphatidate phosphohydrolase, and on the proliferation in cultured human hepatocytes HepG2 cells. Agricultural Chemistry and Biotechnology. 40:577-582.
- Cha JY and Cho YS. (1999). Effect of potato polyphenolics on lipid peroxidation in rats. Journal of the Korean Society of Food Science and Nutrition. 28:1131-1136.
-
Chae KS, Son RH, Park SY, Kim KA, Lee TB and Kwon JW. (2014). Analytical method validation of ellagic acid as a marker compound for the standardization of black raspberry extract as a functional ingredient. Food Engineering Progress. 18:355-358.
[https://doi.org/10.13050/foodengprog.2014.18.4.355]
- Chae YA, Kim SM, Kim KS, Yu CY, Yang DC, Song CG and Kang JH. (2023). Medicinal Botany (6th ed.). Hyangmunsa. Seoul, Korea. p.63-127.
-
Cho YJ, Ju IS, Yun DH, Chun SS, An BJ, Kim JH, and Kim MU. (2008). Biological activity of extracts from garden sage(Salvia officinalis L.). Journal of Applied Biological Chemistry. 51:296-301.
[https://doi.org/10.3839/jabc.2008.046]
-
Choi YH, van Spronsen J, Dai Y, Verberne M, Hollmann F, Arends IW, Witkamp GJ and Verpoorte R. (2011). Are natural deep eutectic solvents the missing link in understanding cellular metabolism and physiology? Plant Physiology. 156: 1701-1705.
[https://doi.org/10.1104/pp.111.178426]
-
Dai Y, van Spronsen J, Witkamp GJ, Verpoorte R and Choi YH. (2013). Natural deep eutectic solvents as new potential media for green technology. Analytica Chimica Acta. 766:61-68.
[https://doi.org/10.1016/j.aca.2012.12.019]
-
Ding Y, Yu B, Zhou S, Ding C, Zhang Z, Xu S and Xu Z. (2023). Improvement of solubility and pharmacokinetic profile of hepatoprotector icariin through complexation with HP-γ-cyclodextrin. Frontiers in Pharmacology. 14:1138686. https://www.frontiersin.org/journals/pharmacology/articles/10.3389/fphar.2023.1138686/full, (cited by 2026 Jun 13).
[https://doi.org/10.3389/fphar.2023.1138686]
-
Freeman BL, Eggett DL and Parker TL. (2010). Synergistic and antagonistic interactions of phenolic compounds found in navel oranges. Journal of Food Science. 75:C570-C576.
[https://doi.org/10.1111/j.1750-3841.2010.01717.x]
- Han YH, Choi BR, Soh HS, Lee SJ, Choi YJ and Kim SY. (2000). In vitro plant regeneration for mass propagation of Epimedium koreanum Nakai. Horticultural Science & Technology, 18:834-838.
- Han Y and Jeong E. (2003). A study of correlation between antioxidant activity and whitening effect of plant extracts. Asian Journal of Beauty and Cosmetology. 1:11-22.
- Hong JK. (2009). A study on skin aging caused by free-radical and on efficacy of antioxidant vitamins. Korean Journal of Aesthetics and Cosmetology. 7:51-62.
- Hosoi J, Abe E, Suda T and Kuroki T. (1985). Regulation of melanin synthesis of B16 mouse melanoma cells by 1α, 25-dihydroxyvitamin D3 and retinoic acid. Cancer Research. 45:1474-1478.
- Jeong JS and Shin MK. (1990). Dictionary of Korean traditional medicine, Youngrim-sa, Seoul. p.386-388.
-
Jørgensen LV, Skibsted LH and Dragsted LO. (1999). Regeneration of phenolic antioxidants from phenoxyl radicals: An ESR and electrochemical study of antioxidant hierarchy. Free Radical Research. 30:207-220.
[https://doi.org/10.1080/10715769900300231]
-
Jovanovic SV, Steenken S, Hara Y and Simic MG. (1996). Reduction potentials of flavonoid and model phenoxyl radicals. Which ring in flavonoids is responsible for antioxidant activity? Journal of the Chemical Society, Perkin Transactions 2. 25:2497-2504.
[https://doi.org/10.1039/p29960002497]
-
Kim SA, Jung JN, Park KB, Kim DH, Cha SA, Lee JH and Choi MS. (2026). A comparison of antioxidant content and radical scavenging activity in the fruits of the native Korean plant Ribes fasciculatum var. chinense by Region. Korean Journal of Medicinal Crop Science. 34:161-171.
[https://doi.org/10.7783/KJMCS.2026.34.3.161]
-
Kang SS, Kang YJ and Lee MW. (1991). Flavonoids from Epimedium koreanum. Journal of Natural Products. 54:542-546.
[https://doi.org/10.1021/np50074a029]
-
Katja S, Antje F, Thomas H, Johannes HS, Stefan M and Wilfried S. (2016). Formation of β-glucogallin, the precursor of ellagic acid in strawberry and raspberry. Journal of Experimental Botany. 67:2299-2308.
[https://doi.org/10.1093/jxb/erw036]
- Kim H and Lee G. (2017). Monitoring for optimum antioxidant extraction condition of Gugija(Lycium chinensis Mill) extract. Journal of Oil & Applied Science. 34:451-460.
-
Kim LS, Youn SH and Kim, JY. (2014). Comparative study on antioxidant effects of extracts from Rubus coreanus and Rubus occidentalis. Journal of the Korean Society of Food Science and Nutrition. 43:1357-1362.
[https://doi.org/10.3746/jkfn.2014.43.9.1357]
-
Kim YJ and Son DY. (2016). Antioxidant activity and suppression of pro-inflammatory mediator of Corni fructus extracts in activated RAW 264.7 macrophage. Korean Journal of Food Preservation. 23:876-882.
[https://doi.org/10.11002/kjfp.2016.23.6.876]
-
Kim YJ, Han SH, Jeon JY, Hwang MH, Im YJ, Chae SW and Kim MG. (2012). Method development of ellagic acid as marker compound for standardization of Gochang Bokbunja(Rubus coreanus Miquel) as functional ingredient. Journal of the Korean Society of Food Science and Nutrition. 41:1554-1558.
[https://doi.org/10.3746/jkfn.2012.41.11.1554]
-
Ko HM, Kim KC and Kim JS. (2025). Phenolic content and antioxidant properties of Cornus kousa fruit extracts at different ethanol concentrations. Korean Journal of Medicinal Crop Science. 33:156-164.
[https://doi.org/10.7783/KJMCS.2025.33.3.156]
-
Koleckar V, Kubikova L, Rehakova Z, Kuca K, Jun D, Jahodar L and Opletal L. (2008). Condensed and hydrolysable tannins as antioxidants influencing the health. Mini-Reviews in Medicinal Chemistry. 8:436-447.
[https://doi.org/10.2174/138955708784223486]
-
Kurin E, Hajská M, Kostovčíková E, Dokupilová K, Mučaji P, Nagy M, Novotný B and Bittner Fialová S. (2025). Unveiling synergistic antioxidant effects of green tea and peppermint: Role of polyphenol interactions and blend preparation. International Journal of Molecular Sciences. 26:6257.
[https://doi.org/10.3390/ijms26136257]
- Lee MK, Lee HS, Choi GP, Oh DH, Kim JD, Yu CH and Lee HY. (2003). Screening of biological activities of the extracts from Rubus coreanus Miq. Korean Journal of Medicinal Crop Science. 11:5-12.
- Lee YH, Kim NY, Cho IY and Lee YS. (2022). Evaluation of anti-aging activity on Lycium chinense extracts. Journal of Oil & Applied Science. 39:126-136.
-
Li Pomi F, Gammeri L, Borgia F, Di Gioacchino M and Gangemi S. (2025). Oxidative stress and skin diseases: The role of lipid peroxidation. Antioxidants. 14:555. https://www.mdpi.com/2076-3921/14/5/555, (cited by 2026 Jun 13).
[https://doi.org/10.3390/antiox14050555]
-
Li WK, Xiao PG and Pan JQ. (1998). Complete assignment of 1H and 13C NMR spectra of ikarisoside A and epimedoside C. Magnetic Resonance in Chemistry. 36:303-304.
[https://doi.org/10.1002/(SICI)1097-458X(199804)36:4<303::AID-OMR187>3.3.CO;2-9]
-
Mamet T, Ge Z, Zhang Y and Li C. (2018). Interactions between highly galloylated persimmon tannins and pectins. International Journal of Biological Macromolecules. 106:410-417.
[https://doi.org/10.1016/j.ijbiomac.2017.08.039]
-
Masci A, Carradori S, Casadei MA, Paolicelli P, Petralito S, Ragno R and Cesa S. (2018). Lycium barbarum polysaccharides: Extraction, purification, structural characterisation and evidence about hypoglycaemic and hypolipidaemic effects. A review. Food chemistry. 254:377-389.
[https://doi.org/10.1016/j.foodchem.2018.01.176]
-
Mi B, Liu J, Liu G, Zhou W, Liu Y, Hu L, Xiong L, Ye S and Wu Y. (2018). Icariin promotes wound healing by enhancing the migration and proliferation of keratinocytes via the AKT and ERK signaling pathway. International Journal of Molecular Medicine. 42:831-838.
[https://doi.org/10.3892/ijmm.2018.3676]
-
Mohammadzadeh M, Zarei M, Abbasi H, Webster TJ and Beheshtizadeh N. (2024). Promoting osteogenesis and bone regeneration employing icariin-loaded nanoplatforms. Journal of Biological Engineering. 18:29.
[https://doi.org/10.1186/s13036-024-00425-4]
-
Ohkatsu Y and Suzuki F. (2011). Synergism between phenolic antioxidants in autoxidation. Journal of the Japan Petroleum Institute. 54:22-29.
[https://doi.org/10.1627/jpi.54.22]
- Oh SM, Moon YJ and Woo WH. (2006). Effect of Rubus coreanum Miquel on the expression of tyrosinase, TRP-1 and TRP-2 in B16 melanoma cells. Korean Journal of Oriental Physiology & Pathology. 20:433-437.
-
Papadopoulos G and Boskou D. (1991). Antioxidant effect of natural phenols on olive oil. Journal of the American Oil Chemists Society. 68:669-671.
[https://doi.org/10.1007/BF02662292]
-
Park S, Choi J and Kim S. (2024). Whitening and anti-wrinkle effects of complex extract of Abelmoschus manihot flower and Opuntia humifusa fruit. Korean Journal of Food Science and Technology. 56:194-201.
[https://doi.org/10.9721/KJFST.2024.56.2.194]
-
Park MH and Kim JS. (2025). Analysis of the physiological activity and composition of Farfugium japonicum fractions. Korean Journal of Medicinal Crop Science. 33:149-155.
[https://doi.org/10.7783/KJMCS.2025.33.3.149]
-
Park YJ, Kim MH and Bae SJ. (2002). Enhancement of anticarcinogenic effect by combination of Lycii fructus with vitamin C. Journal of the Korean Society of Food Science and Nutrition. 31:143-148.
[https://doi.org/10.3746/jkfn.2002.31.1.143]
-
Quideau S, Deffieux D, Douat-Casassus C and Pouységu L. (2011). Plant polyphenols: Chemical properties, biological activities, and synthesis. Angewandte Chemie International Edition. 50:586-621.
[https://doi.org/10.1002/anie.201000044]
-
Sharifi-Rad J, Quispe C, Castillo CMS, Caroca R, Lazo-Vélez MA, Antonyak H, Polishchuk A, Lysiuk R, Oliinyk P, De Masi L, Bontempo P, Martorell M, Daştan SD, Rigano D, Wink M and Cho WC. (2022). Ellagic acid: A review on its natural sources, chemical stability, and therapeutic potential. Oxidative Medicine and Cellular Longevity. 2022:3848084.
[https://doi.org/10.1155/2022/3848084]
- Shin KH, Lim SS, Ahn SD, Kim SK and Park KY. (1996). Difference in components of Epimedium koreanum in compliance with seasons and places of collection. Korean Journal of Medicinal Crop Science. 4:321-328.
-
Song TY, Chen CH, Yang NC, Fu CS, Chang YT and Chen CL. (2009). The correlation of in vitro mushroom tyrosinase activity with cellular tyrosinase activity and melanin formation in melanoma cells A2058. Journal of Food and Drug Analysis. 17:156-162.
[https://doi.org/10.38212/2224-6614.2607]
-
Teslić N, Santos F, Oliveira F, Stupar A, Pojić M, Mandić A, Pavlić B, Kljakić AC, Duarte ARC, Paiva A and Mišan A. (2022). Simultaneous hydrolysis of ellagitannins and extraction of ellagic acid from defatted raspberry seeds using natural deep eutectic solvents (NADES). Antioxidants. 11:254. https://www.mdpi.com/2076-3921/11/2/254, (cited by 2026 Jun 13).
[https://doi.org/10.3390/antiox11020254]
-
Tomita K, Oda N, Ohbayashi M, Kamei H, Miyaki T and Oki T. (1990). A new screening method for melanin biological synthesis inhibitor using Streptomyces bikiniensis. The journal of Antibiotics. 43:1601-1605.
[https://doi.org/10.7164/antibiotics.43.1601]
-
Wang S, Meckling KA, Marcone MF, Kakuda Y and Tsao R. (2011). Synergistic, additive, and antagonistic effects of food mixtures on total antioxidant capacities. Journal of Agricultural and Food Chemistry. 59:960-968.
[https://doi.org/10.1021/jf1040977]
- Xu SC, Xu BJ and Wang MT. (1987). Isolation and identification of icariin and icariside I. Chinese Pharmaceutical Bulletin. 22:129-132.
- Yoo SH and Kim KH. (2018). Study on the protective effect of phenolic compounds from antioxidant plants on PC12 cells. Journal of the Korean Society of Food Culture. 32:44-51.
-
Yang WJ, Li DP, Li JK, Li MH, Chen YL and Zhang PZ. (2009). Synergistic antioxidant activities of eight traditional Chinese herb pairs. Biological and Pharmaceutical Bulletin. 32:1021-1026.
[https://doi.org/10.1248/bpb.32.1021]
-
Zhi W, Zheng Y, Gou D, Guo L, Li Y, Huang H, Du M, Yu D, Lu K, Wang J and Zhou Z. (2026). Icaritin alleviates UVB-induced skin damage by inhibiting ferroptosis via modulation of mitochondrial dynamics. Ecotoxicology and Environmental Safety. 309:119625.
[https://doi.org/10.1016/j.ecoenv.2025.119625]